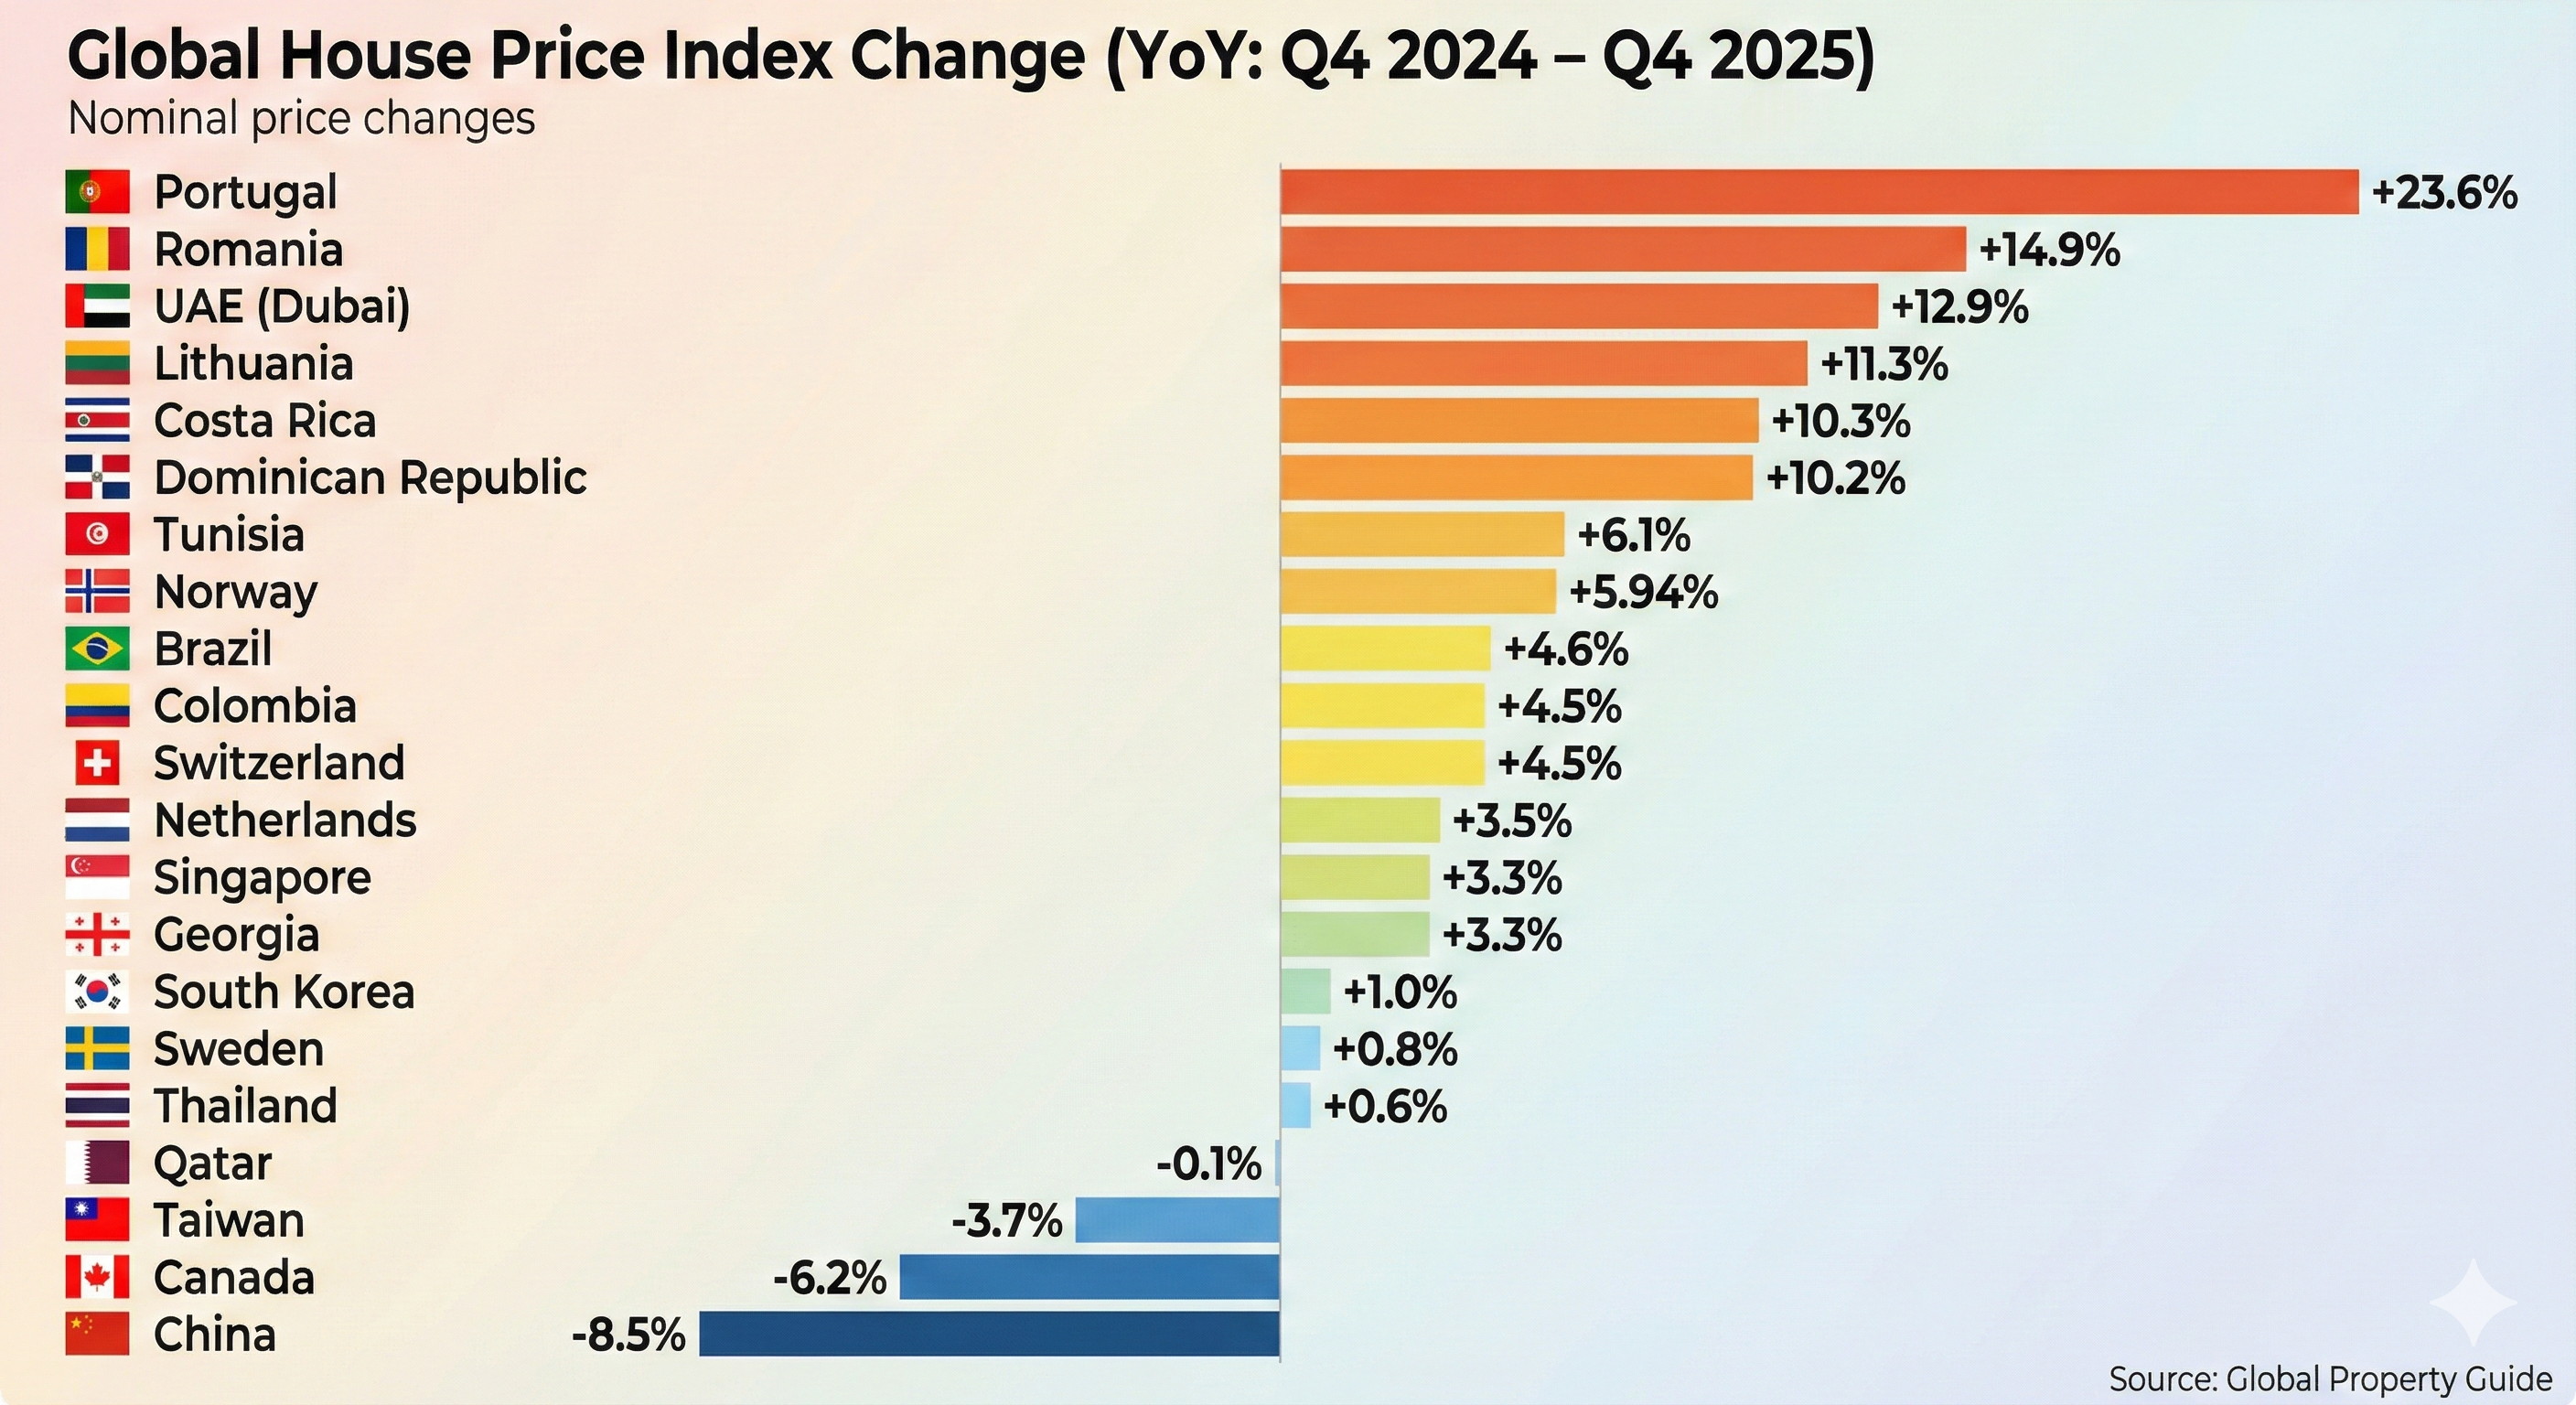
The Q4 2025 data reveals a sharp divergence in global asset classes.
While capital continues to flee into high-yield “sunbelt” markets in Southern Europe and the MENA region, major industrial economies in Asia and North America are facing significant headwinds.
Europe: The “Two-Speed” Continent
Europe is currently the most fractured region in the index, characterized by a massive performance gap between the emerging South/East and the mature North.
- The Boom: 🇵🇹 Portugal (+23.6%) remains the global outlier, driven by acute supply shortages and sustained international demand. This bullish sentiment has spread East, with 🇷🇴 Romania (+14.9%) and 🇱🇹 Lithuania (+11.3%) posting double-digit gains as real wages in these economies catch up to Western standards.
- The Stabilization: In contrast, Northern and Western Europe have entered a period of cooling or low-growth stability. 🇳🇴 Norway (+5.94%) and 🇨🇭 Switzerland (+4.5%) are seeing moderate appreciation, while 🇸🇪 Sweden (+0.8%) remains effectively flat, signaling that the post-pandemic correction in the Nordics has bottomed out but lacks upward momentum.
Asia: The Deep Correction
Asia remains the drag on the global index, weighed down heavily by the “Greater China” correction.
- The Red Zone: 🇨🇳 China (-8.5%) continues to struggle with property sector deleveraging, a trend that is now heavily impacting 🇹🇼 Taiwan (-3.7%), which posted its sharpest decline in three years.
- The Safe Havens: Elsewhere in the region, growth is anemic but positive. 🇸🇬 Singapore (+3.3%) continues to act as a regional safe haven, managing a soft landing. 🇰🇷 South Korea (+1.0%) and 🇹🇭 Thailand (+0.6%) are treading water, reflecting cautious buyer sentiment amidst slowing regional exports.
The Americas: A Sharp North-South Divide
The Western Hemisphere is currently defined by a stark decoupling between the North and South. While the post-pandemic correction has firmly gripped the Canadian market, Latin America and the Caribbean are seeing a resurgence of capital inflows.
- The Northern Correction: 🇨🇦 Canada (-6.2%) stands out as the only major Western market in deep correction territory for this period. After years of aggressive growth, the Canadian market is undergoing a painful price discovery phase, likely triggered by affordability ceilings and renewed mortgage rate pressures that have sidelined domestic buyers.
- The Caribbean & Central Surge: In sharp contrast, the "Sunbelt" trade has gone global. 🇨🇷 Costa Rica (+10.3%) and the 🇩🇴 Dominican Republic (+10.2%) are posting double-digit gains. These markets are decoupling completely from their Northern neighbor, driven by a wave of foreign direct investment and a booming short-term rental market that is driving up asset values.
- South American Stability: Further south, the major economies are showing resilience. 🇧🇷 Brazil (+4.6%) and 🇨🇴 Colombia (+4.5%) have settled into a pattern of steady, mid-single-digit growth. While not overheating like the Caribbean, these markets offer a stable alternative to the volatility seen in North America.
Middle East & North Africa: The Yield Hunt
The MENA region remains a magnet for wealth preservation, though performance is specific to sub-regions.
- The Gulf: 🇦🇪 UAE (Dubai) (+12.9%) continues its multi-year bull run, successfully transitioning from a speculative market to a primary global luxury hub. However, 🇶🇦 Qatar (-0.1%) remains flat, highlighting that regional growth is not uniform.
- North Africa: 🇹🇳 Tunisia (+6.1%) has emerged as a resilient secondary market, posting solid gains likely driven by localized demand dynamics and relative affordability compared to European markets across the Mediterranean.
1 Year House Price Change (Q4 2025 vs. Q4 2024)
| Country | Nominal Change (1yr) | Inflation-Adjusted (Real) |
| 🇵🇹 Portugal | +23.6% | +20.55% |
| 🇷🇴 Romania | +14.9% | +5.82% |
| 🇦🇪 UAE (Dubai) | +12.9% | +9.60% |
| 🇱🇹 Lithuania | +11.3% | +7.63% |
| 🇨🇷 Costa Rica | +10.3% | +11.69% |
| 🇩🇴 Dominican Republic | +10.2% | +5.05% |
| 🇹🇳 Tunisia | +6.1% | +1.04% |
| 🇳🇴 Norway | +5.94% | +2.76% |
| 🇧🇷 Brazil | +4.6% | +0.29% |
| 🇨🇴 Colombia | +4.5% | -0.73% |
| 🇨🇭 Switzerland | +4.5% | +4.47% |
| 🇳🇱 Netherlands | +3.5% | +0.57% |
| 🇸🇬 Singapore | +3.3% | +2.12% |
| 🇬🇪 Georgia | +3.3% | -0.67% |
| 🇰🇷 South Korea | +1.0% | -1.26% |
| 🇸🇪 Sweden | +0.8% | +0.35% |
| 🇹🇭 Thailand | +0.6% | +0.91% |
| 🇶🇦 Qatar | -0.1% | -1.94% |
| 🇹🇼 Taiwan | -3.7% | -4.92% |
| 🇨🇦 Canada | -6.2% | -8.33% |
| 🇨🇳 China | -8.5% | -9.25% |
Data Source: Global Property Guide, Q4 2025 Proprietary Data from ECB, OECD and other national statistics offices.