The Middle East and North Africa region is home to fast-growing property markets, driven by strong population growth, rising foreign investment, and large-scale infrastructure projects.
Beyond the well-known hotspots, there are a number of cities offering strong potential for both capital growth and attractive rental yields.
Below, we highlight some of the most promising markets in the region, based on the latest research and property data from Global Property Guide. These locations stand out for their growth prospects, yield opportunities, and other strategic advantages for international investors.
1. United Arab Emirates
Where to invest: Dubai and Abu Dhabi
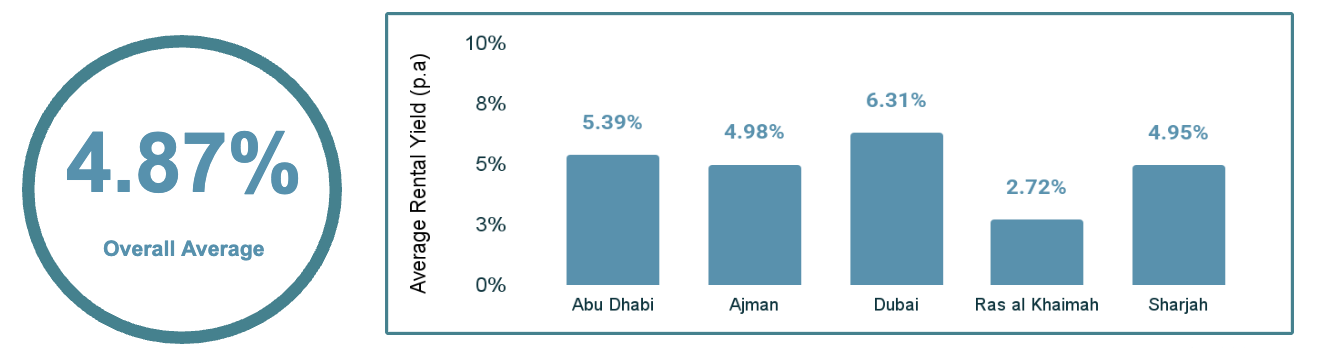
The UAE, and Dubai in particular, continues to be one of the strongest real estate markets in the region, with rental yields averaging around 6–7% and demand supported by international buyers and expats.
Dubai has seen property prices rise sharply in recent years—over 60% in nominal terms since 2021—though rents are now beginning to stabilize after a rapid surge.
Liquidity is high, especially in prime districts, making it easier to buy and sell compared to many neighboring markets. Risks include the potential for cyclical downturns, oversupply in certain segments, and exposure to global economic shifts.
GPG Data (Dubai):
Rental yields in the UAE are currently around 6–7%, with Dubai offering the highest returns and Ras Al Khaimah the lowest.
Dubai property prices have risen by more than 60% in nominal terms, and over 40% when adjusted for inflation. Rents have been climbing steadily since 2021, though they now appear to be flattening out.
The UAE allows foreign ownership of property within designated freehold zones and maintains a tax-friendly environment, with no annual property tax and attractive residency options for investors and entrepreneurs.
2. Turkey
Where to invest: Istanbul, Ankara and other cities
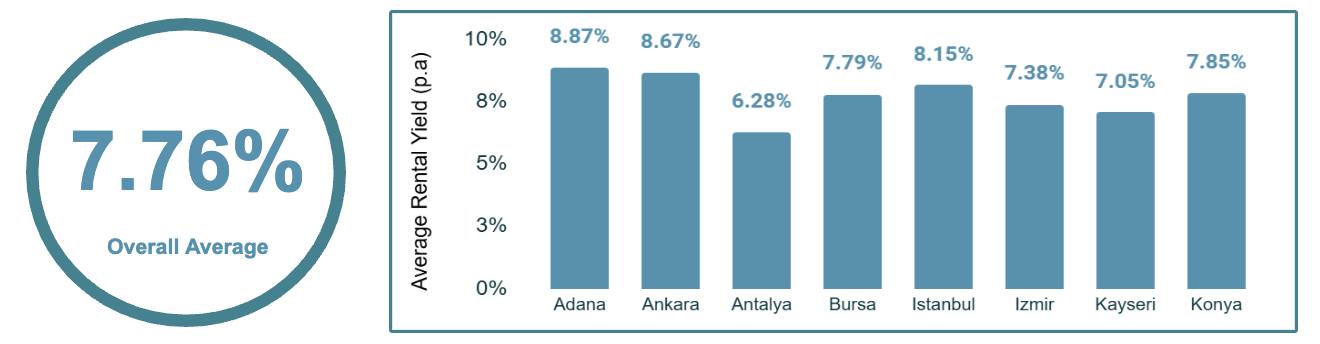
Turkey has become a key market for foreign buyers from Europe, the Middle East, and Russia, drawn by relatively affordable property prices and rental yields often in the 6–8% range. Istanbul, Antalya, and other coastal cities are the most active and liquid markets, offering stronger rental demand and better prospects for price growth.
However, high inflation, volatile exchange rates, and high mortgage rates create significant risks for investors.
While foreign ownership is straightforward and the market remains attractive for lifestyle and investment purposes, returns vary widely depending on location and timing.
GPG Data (Istanbul):
Real (inflation-adjusted) performance is often weak, which is key for foreign investors tracking in USD/EUR. In some years, values have surged by 20%, only to fall by 10% the following year. Mortgage rates remain exceptionally high, currently at around 40%.
There are no major restrictions on foreign ownership of property, and Turkey also offers favorable tax policies for digital nomads and new residents.
3. Egypt
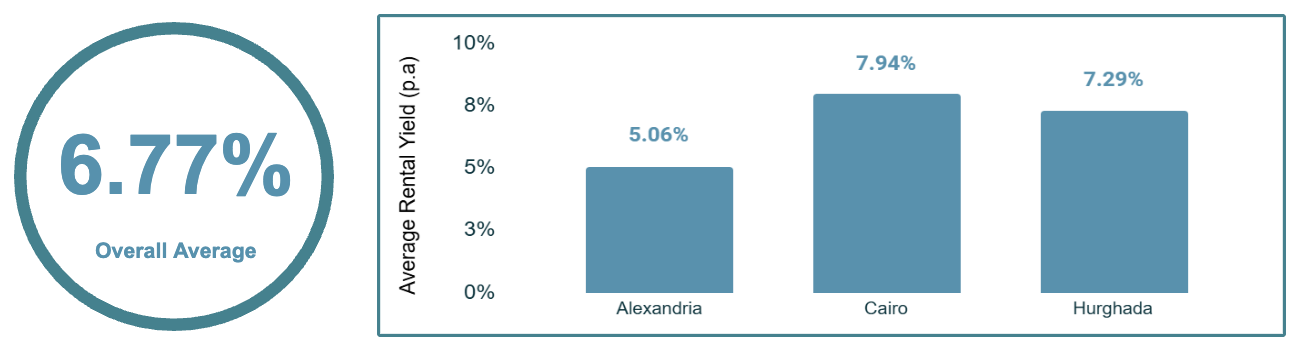
Where to invest: Cairo and Hurghada
GPG Data (Cairo):
Real estate prices in Egypt have risen significantly in nominal terms, but when adjusted for high inflation, growth has been minimal over the past five years.
Median asking prices, however, show an upward trend in USD terms. The landlord–tenant law remains relatively neutral.
4. Saudi Arabia
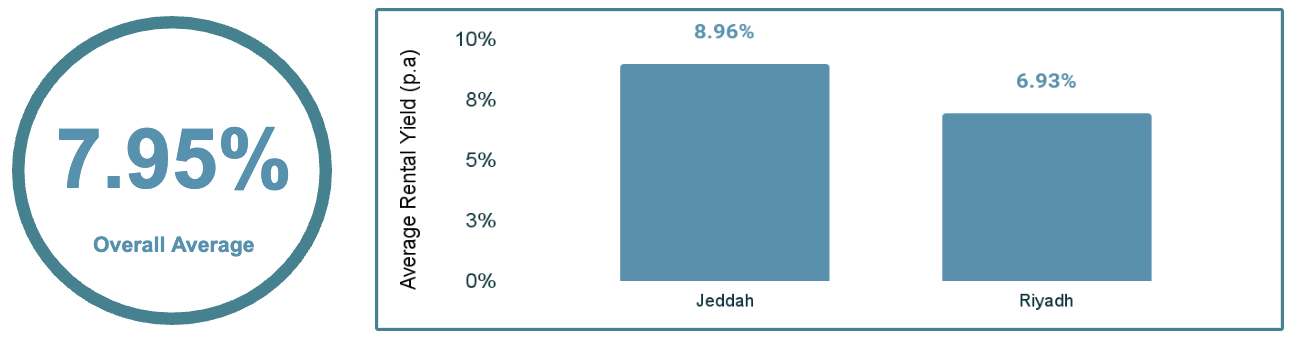
Where to invest: Jeddah and Riyadh
GPG Data (Jeddah):
Between 2015 and 2022, rent prices in Saudi Arabia were on the decline, but they have recently begun rising by around 9–10% annually. Property prices increased between 2021 and 2023, growing by roughly 10% per year, though they have since leveled off.
The regulatory environment is generally pro-landlord, and property and real estate taxes remain relatively low compared to Europe.
5. Qatar
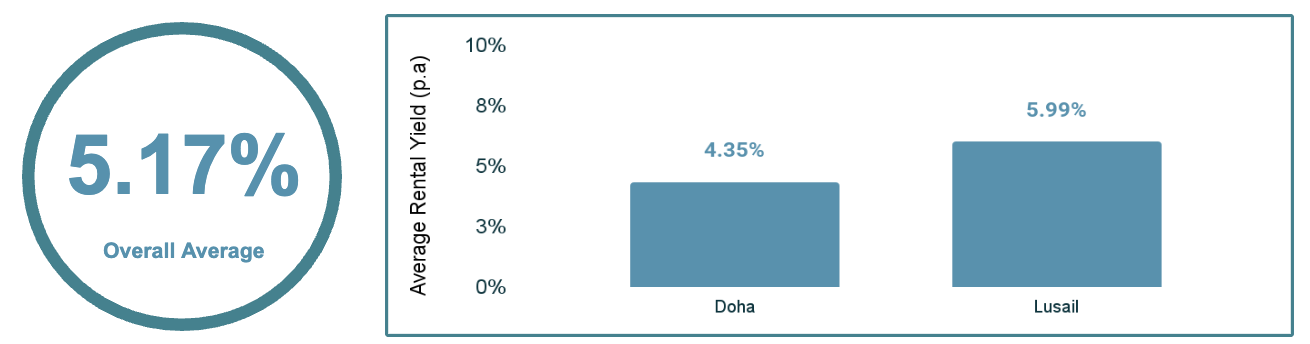
Where to invest: Lusail and Doha
Qatar’s property market reached a peak in 2014–2015, driven by high oil revenues, rapid development, and expectations around the 2022 FIFA World Cup. However, the sharp drop in oil prices, combined with oversupply in Doha’s major projects such as The Pearl and Lusail, triggered a sustained decline in both sales prices and rents.
Doha remains the most active and liquid market, but despite moderate rental yields of around 5–6%, property values have struggled to regain their earlier highs.
Foreign ownership is permitted in designated zones such as The Pearl and West Bay Lagoon, offering access for international buyers but still within limited areas.
GPG Data (Lusail):
Over the past five years, property prices in Qatar have shown negative growth when adjusted for inflation, while nominal price changes have remained minimal. The residential rent index has been declining since its 2022 peak. Property taxes are very low, and the regulatory environment is generally pro-landlord.
Interested in researching more MENA countries?
Global Property Guide offers in-depth data to help you compare and analyze property opportunities across the continent. Whether you're looking for affordability, rental income, or capital growth, our resources can help you make smarter decisions.
-
Square Meter Prices – Compare property prices across MENA countries/cities
-
Long-Term Rental Yields – Find out where rental income is strongest
-
Median Buy Prices – See what it costs to purchase property in key markets
-
Median Rent Prices – Understand local rental dynamics at a glance
Explore the pages below for a clearer view of where value and opportunity lie in MENA's real estate markets. If you're considering purchasing property in the region and would like guidance, feel free to get in touch.