More and more property investors are looking beyond their home countries in search of better yields, potential price growth, and tax-friendly markets. Europe continues to be a popular region, but not all countries are equally attractive right now.
In many places, high prices, low rental returns, sluggish price appreciation, and even political risk make it hard to justify buying. That said, there are still good opportunities if you know where to look — especially for buy-to-let investors willing to go beyond the obvious markets.
Here are some of the most promising countries in Europe to invest in real estate right now, based on real data from Global Property Guide — including rental yields, median prices, and rental income.
1. Italy
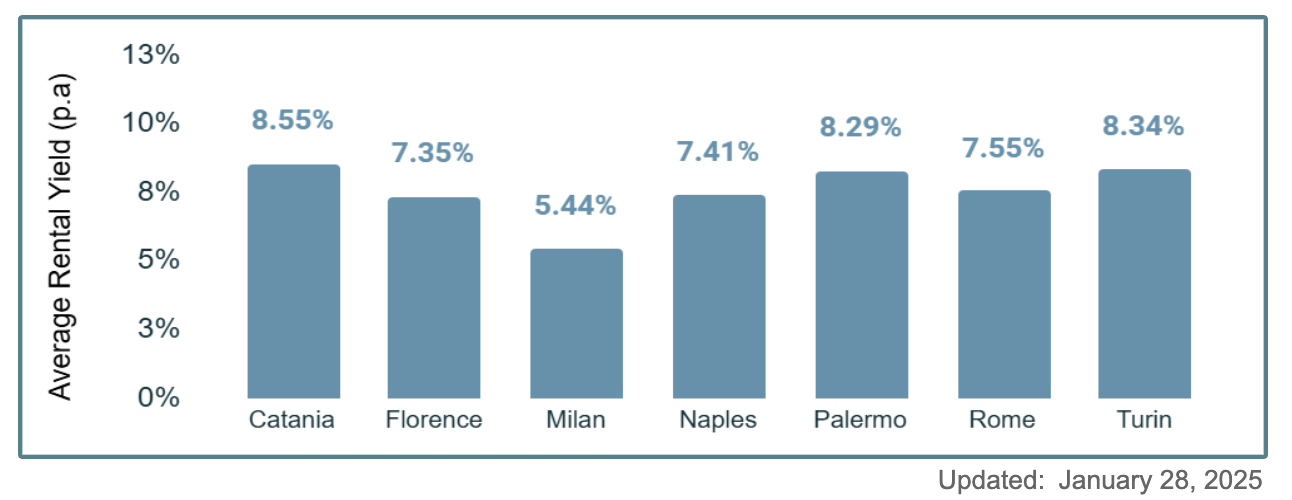
Where to invest: Sicily and Florence
Italy remains an interesting option, especially in areas where prices are still reasonable. Florence has strong tourism and decent rental demand, while parts of Sicily offer surprisingly affordable homes. Italy also has tax incentives for new residents, which can make a difference for foreigners moving in.
GPG Data (Florence):
Keep in mind that over the past five years, property prices in Italy have only risen by around 15% in nominal terms. Once adjusted for inflation — which has been relatively high since 2019 — real price growth is actually negative, at -2.22%.
Certain areas in Italy are also well-suited for short-term rentals, with the potential to generate net yields that are comparable to—or slightly higher than—those from long-term rentals. Here’s an example of a strong-performing Airbnb listed on Global Property Guide Listings.
2. Spain

Where to invest: Barcelona, Valencia or Murcia
Several Spanish cities remain attractive for long-term rentals, especially in areas just outside the city center where property prices are lower but rents remain strong.
For short-term rentals, you'll need to focus on regions where licenses are still obtainable—such as parts of the southern coast (Malaga). While Spain's rental regulations are becoming more restrictive, it remains a transparent and familiar market for investors.
GPG Data (Valencia):
Like Italy, property price growth in Spain has been modest in recent years. Over the past five years, prices have increased by little over 19% in nominal terms, but when adjusted for inflation, the real growth is just 0.81%.
Short-term rentals are regulated in urban areas, but licenses can be obtained if you follow the proper process. Restrictions tend to be looser for villas compared to condos. Yields typically range from 5% to 6% (see example).
It's also worth noting that Spain is considering a proposal to impose a 100% stamp duty surcharge on non-EU foreign buyers. It’s still unclear whether this would apply to non-residents purchasing through a company structure.
3. Ireland

Where to invest: Dublin and Cork
Dublin has some of the highest property prices in Europe, but it also commands some of the highest rental rates, which helps balance the equation for long-term investors—particularly in central neighborhoods. Cork is also worth considering, offering lower entry prices while still benefiting from solid rental demand and a growing local economy.
GPG Data (Dublin):
Unlike Spain and Italy, property prices in Ireland have surged since 2012. Over the past decade, home prices have nearly doubled—up 99% in nominal terms—with inflation-adjusted growth at just over 61%. Rents have also climbed significantly, rising by 71% over the same period.
Ireland imposes no restrictions on foreign buyers. Properties can be purchased either as an individual or through a company structure. As with most markets, net yields tend to be 1.5% to 2% lower than gross yields—so a 7% gross yield typically translates to around 5% net for long-term rentals.
Based on our research, short-term rentals in Ireland are generally not a viable strategy.
4. Latvia

Where to invest: Riga
The residential real estate market in Riga continues to offer some of the best yields in Europe. Property prices are low, rental demand is steady, and both short- and long-term strategies can be profitable. While it’s not currently a strong market for capital appreciation, it’s definitely worth considering for cash flow-focused investors.
GPG Data (Riga):
Similar to Greece, inflation-adjusted property prices in Riga have yet to fully recover. In fact, Riga has underperformed significantly in recent years. Over the past five years, property prices have dropped by 23.66% in real (inflation-adjusted) terms, while nominal growth has been minimal—just 3.77%.
On the downside, this suggests a weak capital appreciation story and signals that the market may still be facing structural or economic headwinds. Investors looking for long-term price growth may find better opportunities elsewhere. However, this price stagnation has helped keep entry points low, and combined with strong rental yields, Riga can still be a compelling choice for investors focused on income rather than appreciation.
5. Montenegro

Where to invest: Budva, Tivat or Podgorica
Montenegro isn’t perfect, but its fundamentals are strong. It’s outside the EU but uses the euro, has low taxes, and allows full foreign ownership. Property prices remain low compared to neighboring countries, and tourism continues to grow.
This is less of a rental yield or cash flow strategy, and more of a diversification and capital appreciation play.
GPG Data (Podgorica):
If you look at how property prices have changed in Montenegro over the last 5–15 years, the picture is quite positive. Over the past five years, average national square meter prices for new residential dwellings have increased from €1,200 to nearly €1,900. Whether this price growth will continue is unclear, but fortunately for investors, rents have also risen.
Short-term rentals in Montenegro usually offer similar yields to long-term rentals because the tourist season is relatively short, typically from May to September.
6. Poland

Where to invest: Warsaw, Lodz and Gdansk
Poland is a strong, stable market with a growing middle class and solid long-term prospects. Warsaw and many other cities offer both reliable rental demand and fairly priced properties. It’s more of a slow-and-steady investment—less excitement, but strong fundamentals.
GPG Data (Warsaw):
Like several other growing European real estate markets, Poland has experienced strong growth over the past five years. Nominal property prices have increased by 73%, while inflation-adjusted prices have risen by nearly 19%.
7. Hungary

Where to invest: Budapest
Hungary is an affordable market with good long-term potential. Budapest is the main focus for foreign investors, but other cities also offer steady rental demand and reasonably priced properties. It’s not the fastest-growing market in Europe, but the fundamentals are strong—making it a reliable, long-term investment.
GPG Data (Budapest):
Hungary may not offer the highest rental yields in Europe, but property price growth has been impressive. Over the past five years, average prices have increased by more than 94% in nominal terms, and by nearly 28% after adjusting for inflation. It’s uncertain whether this growth will continue, but rents are also rising steadily.
Short-term rentals are still possible in Hungary, but regulations are becoming increasingly strict. That said, there are still some properties available (see example) that can generate higher net yields than traditional long-term rentals.
8. Romania

Where to Invest: Bucharest and Galati
Romania offers some of the cheapest property in the Europe (similarly to Riga), especially in city centers like Bucharest. Rental demand is solid, and the taxes are low. It's not the most glamorous market, but if you’re focused on steady returns, it makes sense.
GPG Data (Bucharest):
Due to high inflation, Romania’s real (inflation-adjusted) property prices have mostly stagnated since 2022, even though nominal prices continue to rise. Compared to other markets in the region, Romania appears to be more volatile.
In Bucharest, short-term rentals can offer similar or slightly lower net yields than long-term rentals, but they may still be a good alternative depending on location and property type, especially for investors seeking more flexible strategies.
Interested in researching more European countries?
Global Property Guide offers in-depth data to help you compare and analyze property opportunities across the continent. Whether you're looking for affordability, rental income, or capital growth, our resources can help you make smarter decisions.
-
Square Meter Prices – Compare property prices across European countries/cities
-
Long-Term Rental Yields – Find out where rental income is strongest
-
Median Buy Prices – See what it costs to purchase property in key markets
-
Median Rent Prices – Understand local rental dynamics at a glance
Browse these pages to get a clearer picture of where value and opportunity lie in Europe's real estate landscape. If you need help buying a property in Europe, do not hesitate to contact us.