China´s house price boom over in the 1st tier cities
Home price rises are slowing in China´s biggest cities. But they´re still picking up in the regional centres. So the average price of new dwellings in China´s 70 cities rose by 10.78% y-o-y in June 2019, based on the figures from the National Bureau of Statistics of China. Recent price growth nationally was even faster than six months ago as 2018 ended with a house price rise of 9.7% y-o-y in December 2018.
In June 2019, new home prices went up in 63 out of the total 70 cities, down from 67 cities in May, based on the NBS survey. Most of the price gains were felt in the second and third-tier cities, while the four top-tiered cities had weaker price growth, with an average increase of 0.2% on the previous month.
"The drop in growth reflects the growing expectation of more tightening measures to come. As many as 251 real estate restriction policies were announced in the first half of this year, 31% more than the same period last year," said Centaline Property Agency Ltd.´s chief analyst Zhang Dawei.
Among the four top-tier cities, Shenzhen saw the highest house price rise in June 2019, with house prices increasing by 0.5% on the previous month. Shanghai and Guangzhou both saw a 0.3% m-o-m growth. In contrast, Beijing saw a slight drop in prices by 0.1% from the previous month, according to the NBS.
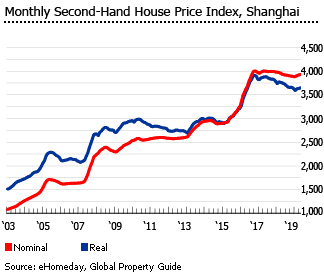
In Shanghai, the second-hand house price index barely rose (up by 0.08%, or -2.5% inflation-adjusted) during the year to June 2019, an improvement from the 1.8% y-o-y (-3.5% inflation-adjusted) price decline in June 2018, according to Ehomeday.
According to Savills China, in Q2 2019:
- In Beijing, the average price of high-end apartments rose by 0.7% q-o-q and by 5.3% y-o-y to CNY 96,915 (US$ 13,780) per square metre (sq. m.). The average price of high-end villas increased by 0.3% q-o-q and by 2.7% y-o-y to CNY 72,070 (US$ 10,247) per sq. m.
- In Shanghai, the average transaction price of first-hand mass commodity residential housing fell by 4.1% q-o-q to CNY 54,200 (US$ 7,707) per sq. m. in Q2 2019.
- In Shenzhen, the average transaction price of a first-hand residential housing rose by 1.3% to CNY 55,632 (US$ 7,910) during the year to Q2 2019. However, prices were down by 3.6% q-o-q.
- In Guangzhou, the average sales price of residential units increased by 5.9% q-o-q to CNY 28,937 (US$ 4,114) per sq. m. in Q2 2019.
Recent history of China´s housing market
During the global crisis China´s housing market slowed sharply. In November 2008 the government introduced a CNY4 trillion (US$585 billion) post-financial crisis stimulus package. Developers were now easily able obtain loans, with lower capital requirements.
Buyers took advantage, with looser lending conditions and lower interest rates. The result? Existing house prices surged by 19.7% in Beijing during 2013 (16.77% inflation-adjusted), and rose by 12.85% in Shanghai (10.13% inflation-adjusted). In 2014, house prices in Beijing fell by 4.11% (-5.45% inflation-adjusted), but prices surged again by 21.01% (19.09% inflation-adjusted) in 2015 and 36.73% (34.06% inflation-adjusted) in 2016. In 2017, house prices started to cool down due to the tighter government measures implemented in late 2016.
Rules on who can purchase property
Foreigners who have worked or studied in China for at least a year are allowed to buy a home. Foreigners go through supervision procedures which last about a week, before they are allowed to buy properties in designated areas.
Foreigners cannot be landlords. Property ownership for investment by foreign companies and individuals is prohibited. Chinese living overseas and residents of Hong Kong and Macau are exempt from these restrictions.
There is no private ownership of land in China. One can only obtain rights to use land. A land lease of up to 70 years is usually granted for residential purposes.
Despite official tightening, more high-end supply in Beijing
The government continues to implement tighter measures and closely monitoring the housing market (especially the first and second-tier cities), in order to steer the country away from a potential property market crash.
In Beijing, however, new supply volumes of residential properties rose by 46.8% y-o-y to 1.26 million square metres (sq. m.) during the second quarter of 2019, due to easier pre-sale permit approvals for residential projects, according to Savills China.
In Q2 2019, four high-end apartments debuted, adding 740 units to the sales market. Six high-end villa developments were granted pre-sale permits in Q2 2019, contributing 466 units to the market.
Beijing´s mass market residential transaction volumes increased by 215% y-o-y to 1.98 million sq. m. in Q2 2019, while high-end villa sales volumes rose by 108% y-o-y to 156 units, according to Savills
Sales of luxury apartments rose by 27.4% from the previous quarter in Q1 2019, according to Jones Lang LaSalle (JLL).
In Shanghai, overall commodity residential supply expanded by 43.6% y-o-y in Q2 2019 to 2.09 million sq. m. High-end apartment supply only came from the new batches of existing projects: the Joffre Classic and Jing’an Prime Land, which contributed a total of 185 units.
High-end sales in Shanghai dropped by 20% q-o-q to 642 units in Q1 2019, mainly due to limited supply. Sales of both mass and high-end markets are expected to remain subdued in the first half of 2019, and will slightly recover in the second half of the year, according to JLL.
Mortgage market is still expanding
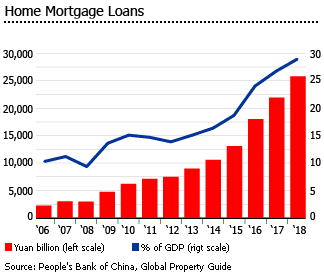
Over the last decade, home mortgage loans in China have expanded threefold, to 29.1% of GDP in 2018, from 9.3% of GDP in 2008. That growth has taken place because property prices in China have risen so rapidly. This past year the trend continued. Outstanding housing mortgages rose by 17.8% to CNY 25.8 trillion (US$ 3.75 trillion) in 2018, according to the People´s Bank of China (PBOC).
Mortgage lending is dominated by state-owned commercial banks. Banks prefer to offer loans for new housing. The mortgage market for old housing is undeveloped. Banks lean on real estate developers when buyers default on loans.
The mortgage market is led by four major state-owned commercial banks namely: Bank of China, China Agriculture Bank, China Construction Bank and Industrial and Commercial Bank of China.
Ballooning debt poses a threat to China´s banking system.
Household debt is now the main driver of aggregate loan growth in China, with an average growth of 27% annually over the past three years. Such debt outpaced corporate borrowing in early 2018. As of 2018, China´s household debt was at 52.6% of GDP, an increase of more than 30 percentage points over the last decade, based on figures from the Bank for International Settlements (BIS). Residential mortgage loans accounted for 59% of the country´s total household debt in June 2018.
"Overall, the risks related to household debt in China are generally viewed as manageable by most observers," noted a report by Federal Reserve Bank of New York economists Hunter Clark and Jeff Dawson. "However, it is important to caution against being overly sanguine, especially since aggregate measures of debt and income may mask important differences among households," according to Clark and Dawson.
In its financial system stability assessment in December 2017, the International Monetary Fund (IMF) warned China on its rising debt-dependency. "Credit growth has outpaced GDP growth, leading to a large credit overhang. The credit-to-GDP ratio is now about 25% above the long-term trend, very high by international standards and consistent with a high probability of financial distress," according to the IMF report. "As a result, corporate debt has reached 165% of GDP, and household debt, while still low, has risen by 15 percentage points of GDP over the past five years and is increasingly linked to asset-price speculation. The buildup of credit in traditional sectors has gone hand-in-hand with a slowdown of productivity growth and pressures on asset quality."
The IMF already issued a warning to China in 2016, stating that the country´s credit had been growing "very fast" by global standards.
In response to the IMF´s earlier call, Zhou Xiaochuan, the People´s Bank of China (PBOC) governor, stated that China will try to control credit growth. "It´s a kind of fine-tuning of policy priorities," according to Fudan University economics professor Li Weisen. "China needs to improve control over bank credit, and home mortgage loans are expected to slow from October on."
In October 2016, the PBOC demanded executives of 17 banks to intensify efforts in restraining home loans, according to a report from Caixin Online. The meeting included officials from China´s "Big Five" banks: the Bank of China, the Agricultural Bank of China, China Construction Bank, the Industrial and Commercial Bank of China, and the Bank of Communications.
Tianjin City, the country´s major port city and was among 15 cities that adopted tightening measures in October 2016, and announced of having even stricter measures in November. Shanghai also stated in a Weibo post that it will implement tighter mortgage loan policies beginning November 29,2016. Other cities such as Wuhan and Shenzhen also introduced mortgage controls.
The central bank intensified its house price curbing measures in March 2017, by releasing new credit policy guidelines for commercial banks to reign the pace of mortgage loan issuance among other things, as well as to adjust credit policies which would control the flow of bank credit to the real estate sector. During the same month, the PBOC also announced tighter housing mortgage rules in Beijing, which raised down payment for second homes and suspended housing loans with maturity of 25 years and above in March 2017.
In September 2017, eight cities (namely Changsha, Chongqing, Guiyang, Nanchang, Nanning, Shijiazhuang, Xi´an, and Wuhan) reportedly imposed new house purchase controls, most of which include banning home resale two to three years after its purchase.
The housing market curbing measures continue in 2018. Local governments in lower-tier cities also started rolling out stricter restrictions in mortgage ratios, pre-sale pricing and sales, adhering the Ministry of Housing and Urban-Rural Development´s call on not loosening regulatory measures and sticking to the real estate management goals.
The continuous implementation of tighter policies has resulted in slower growth of real estate mortgage loans. By end of 2018, outstanding loans to the real estate sector had grown by 20% y-o-y to CNY 38.7 trillion (US$ 5.58 trillion), a 0.9 percentage point slower from the previous year´s growth, according to the People´s Bank of China´s Monetary Policy Report for Q4 2018. Outstanding individual mortgage loans were up by 17.8% as of December 2018, down by 4.4 percentage points from end-2017´s growth.
In early 2019, some local governments loosened their home purchase restrictions in order to boost economic activity. However, the Chinese regulator China Banking and Insurance Regulatory Commission (CBIRC) was recently reported to launch a special inspection on 75 banks in 30 cities to detect violations by institutions in lending to home buyers and developers, as part of the country´s campaign in curbing housing market speculations.
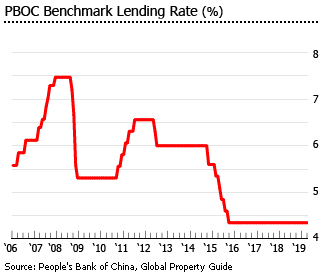
The People´s Bank of China´s (PBOC) key interest rate has remained steady at around 4.35% since October 2015, the central bank´s sixth rate cut since November 2014.
Too much government intervention?
Arguably, one of the Chinese housing market´s central problems has been excessive government intervention, exaggerating the housing cycle. The government steps in to avoid over-heating - then steps in again, to avoid the resulting slump. So China´s housing market see-saws between one extreme and the other, within the general context of an over-valued and over-stocked housing market.
During the boom of 2008, house building boomed so much that the ratio of residential floor space under construction to floor space sold also rose sharply. In 2008, for every one sq. m. of space sold, 3.9 sq. m. was under construction. The ratio rose to a record high of around 4.4 sq. m. in 2012, according to China economist Patrick Chovanec.
In March 2013 the State Council reasserted control. Major cities were required to publish an annual housing price control target. Cities with overheating housing markets were required to increase their supply of "commodity" housing, and their land supply. Where dwelling price rises exceeded city price control targets, People´s Bank of China (PBOC) branches were asked to increase down-payment requirements. Tighter mortgage restrictions on second home purchases were introduced, and buyers without a local registration barred from buying more than one property. Banks were forbidden to give loans to developers hoarding land. Local governments were required to boost low-income housing production. The government also continued to reform property taxes.
In October 2013 Beijing introduced a new scheme to house middle-income earners, through dwellings costing 30% less than normal residential dwellings. And in November 2013, Shanghai´s municipal government increased minimum down payments for second home purchases from 60% to 70%. Non-Shanghai residents also faced tighter qualifications to purchase homes in Shanghai.
Due to these tightening measures, the housing market slowed sharply. During 2014 house prices dropped in Beijing and Shanghai by 4.16% (-5.67% inflation-adjusted) and 1.33% (-2.89% inflation-adjusted), respectively.
So in 2014 the government again went into reverse. In September 2014 the central bank loosened mortgage restrictions, giving homeowners with paid-off mortgages wanting a second property the same terms as first-time buyers, including a down payment minimum of 30% (previous minimum: 60%). In October the central bank cut its benchmark one-year lending rate by 25 basis points to 4.35%. Mortgage interest rates for first-home purchases fell to a new record low. The government also announced a plan to purchase unsold residential properties, and convert them into low-cost housing, in order to reduce inventory levels. In 2015, the government reduced the minimum downpayment for second-home buyers three times, and in March 2015, property sellers were exempted from paying transaction tax if they had owned the property for at least two years.
In late 2016, as a result of the subsequent boom, local governments began implementing tightening measures - these same measures that have successfully slowed the market.
Rental yields are extremely low
Rental yields in Beijing and Shanghai are, we believe, extremely low, based on the Global Property Guide research in March 2018. This is partly because homes are used as investments and "stores of value", and so there is an imbalance between homes available and renters.
Gross rental yields for apartments in Beijing ranges from around 1.81% to 2.1%. In Shanghai, rental yields were a bit higher ranging from 2% to almost 3%, while apartments in Shenzhen have yields ranging from 1.73% to 1.92%.
The rental market in China is heavily regulated, and the system favours the landlord. The landlord may get large payments for breaches of contract committed by the tenant. Although major cities have no rent controls, smaller cities may have.
In Beijing, the average rent of high -end apartments increased by around 4.5% y-o-y in Q1 2019 to CNY 172.2 (US$ 25.04) per square metre (sq. m.) per month, according to Savills China. High-end villas in the capital city also had an increase in their monthly rents, rising by 6.5% y-o-y to CNY 130.7 (US$ 19.01) per sq. m. during the same quarter. As for the serviced apartment market, rents surged even more by around 7.7% to CNY 255.53 (US$ 37.16) per sq. m. during the year to Q1 2019.
The average owner occupancy rate of serviced apartment in Beijing dropped by 2 percentage points y-o-y to 86.9% in Q1 2019. This was due to having a flat demand amid the total stock increase with the launching of two new serviced apartment projects in the first quarter, according to Savills China. Meanwhile, the high-end apartment market continued to have a stable leasing demand in the first quarter, with its average occupancy rate slightly up by 0.3 percentage points to 93%.
In Shanghai, the average rent of the overall residential properties slightly dropped by 0.2% from the previous quarter, but increased by around 3.8% y-o-y to CNY 204.8 (US$ 29.78) per sq. m. per month in Q1 2019.
Slower economic growth in 2019
In Q2 2019, China´s economy expanded by around 6.2% y-o-y, down from 6.6% in 2018, and the country´s weakest growth since the National Bureau of Statistics of China (NBS) started publishing quarterly GDP data in 1992. While the government continues to implement a fiscal stimulus to support domestic demand, these efforts were overshadowed by the current trade war´s negative spillovers not only on exports, but as well as investments.
"Uncertainty caused by the US-China trade war was an important factor and we think this will persist, despite the recent tariff truce," according to The Economist Intelligence Unit´s principal economist for China Tom Rafferty. "Businesses remain skeptical that the two countries will reach a broader trade agreement and recognise that trade tensions may escalate again."
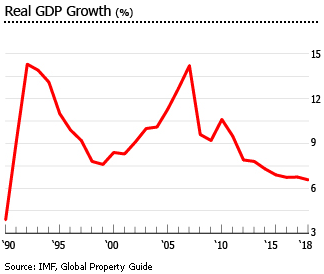
From an average growth rate of 12.7% annually from 2005 to 2007, China has experienced a slowdown in recent years, with an average annual real GDP growth rate of 8.4% from 2008 to 2016. In 2017, China´s economy expanded 6.8%, up from 6.7% in 2016.
Despite slowing economic growth in 2018, China still managed to contribute around 30% to the world´s economic growth, according to NBS bureau head Ning Jizhe. Ning noted that the "slowing but stabilizing" economy was not an easy feat, as the country faced several headwinds in 2018 such as unilateralism, increasing protectionism, severe fluctuations in bulk commodity prices, and weak global demand.
In 2019, China´s economy is expected to slow down further to 6.2%, according to the IMF. "The near-term outlook [of the Chinese economy] remains particularly uncertain given the potential for further escalation of trade tensions," according to iMF´s first deputy managing director David Lipton.
The US-China trade war began in 2017, when the US started to investigate China´s alleged unfair trade practices. This led the US to imposing tariffs on 128 Chinese products in April 2018, and it has been imposing more tariffs since then. Meanwhile, China retaliated by imposing tariffs on US goods. In 2018, the US imposed tariffs on a total of US$250 billion worth of Chinese products, 46% of all Chinese goods imported into the US during that year, according to the US Census Bureau and BBC research. China, on the other hand, imposed tariffs on US$ 110 billion worth of US products, almost 92% of the total US goods imported into China in 2018.
The tension between the two countries escalated further when Chinese tech giant Huawei´s chief financial officer Meng Wanzhou, was arrested in Vancouver in December 2018. The executive faces 23 criminal charges and was accused by the US authorities in covering up Huawei´s violations of US sanctions on Iran. A few months prior, the US enacted the National Defence Authorisation Act, which bans the use of Huawei and ZTE products due to potential security risks.
The two countries agreed to a "truce" in the trade war during the G20 Osaka summit in June 2019. In their agreement, the currently imposed tariffs will still be effective, but no further tariffs will be imposed "for the time being", while the two countries restart their negotiations.
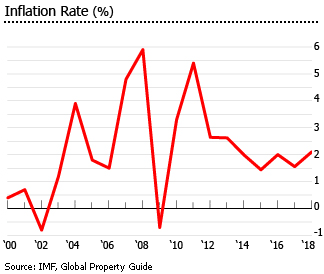
China´s annual inflation rose by 2.7% in June 2019, according to the NBS. Urban unemployment in China was at a historic low of 3.61% at the end of the second quarter, down from 3.67% in the previous quarter, according to the NBS. During the first half of 2019, the number of urban jobs rose by 7.37 million, reaching around 67% of this year´s official jobs target.
pears in chinese culture, chinese lucky numbers for house, selling real estate to chinese, chinese real estate website, chinese real estate agent, juwai real estate, how to find chinese real estate investors, chinese real estate investors, chinese superstitions when buying a house, chinese real estates, chinese real estate agents, fang com, selling real estate to chinese investors, selling property to chinese investors, chinese property investors, chinese real estate agency, chinese business card, chinese real estate buyers, pears chinese culture, may day china, chinese real estate brokers, chineses, chinese real estate investment, chinese drinking culture, chinese mls, chinese business cards, florida chinese news, carrie law, chinese realtors, chinese labor day, chinese real estate broker, chinese real estate company, labor day china, china real estate investors, china labor day, new year 2016 sales, asian mls real estate, chinese investors real estate, chinese business cards etiquette, chinese real estate for sale, asian real estate agents, sihanoukville real estate, chinese business card etiquette, what do chinese buyers look for in a home, selling real estate to chinese buyers, china business cards, compradores en china, china real estate listings, chinese buying website, china buyer, labor day in china, china may day, proptech definition, chinese buyers of us real estate, cinesi, mls china, china real estate companies, chinese home buyers, china property listings, may day holiday china, long and foster portal, chinese travellers, may day in china, china golden week 2015, chinese properties, labour day china, chinese name card, california desert association of realtors, property portal watch, chinese real estate, international real estate marketing, singles day 2016, are pears bad luck in china, golden week 2017, asian real estate agent, may 1 holiday in china, national singles day 2016, chinese community in florida, chinese may day, chinese house numbers, site chinois, real estate chinese, holiday destinations 2017, chinese buyers, how to find chinese investors, find chinese investors, chinese in florida, china real estate for sale, golden week 2016, tower place london, property index, chinese real estate companies, chinese population in florida, how to find foreign investors for real estate, international real estate advertising, china real estate investments, labor day in chinese, selling property in china, chinese buyers real estate, suumo japan, gifting in china, china listings, business cards china, chinese drinking, real estate in china for sale, year of the goat, new year sales 2016, golden week 2015, china estate, chinese labor day 2017, drinking in china, hotel buyers list, chinese trends, the year of the goat, chinese buying real estate, lucky house number, singles day vs black friday, chinese sale sites, chinese moon cakes, gift giving in china, china real estate company, chinese gift giving, how to attract international real estate buyers, property for sale in china, real estate in china, por mhub, chinese pull back from u.s. property investments, jennifer berman real estate, are pears a symbol of bad luck, chinese new year 2017 singapore, finding chinese investors, agent summit 2016, medical tourism companies in china, goat year, ny state mls, 2015 year of the goat, frank gehry hong kong, at home international china, japan golden week 2017, buy real estate in china, chinese new year 2017 vacation, china real estate news, chinese buying sites, sell my china, face culture, buying properties in china, property in china, travel destinations 2017, asian skiing, china realty, asian websites, buying property in china, goat year 1991, giving face, real estate china, china golden week 2018, chinese newspaper nyc, chinese golden week 2016, nystatemls, ben chen billionaire, living shangrila, chinese news year 2016, gift china, bottoms up in chinese, pears symbol of bad luck, nysmls.com, chinese golden week 2017, what does the chinese drink toast, ganbei, literally translate to in english, les chinois, japan buyers, chinese new year 2017, jay chou wedding, buying a house in china, golden week china 2018, chinese market website, richest real estate investors, shopping overseas, china real estate, premier agent resource center, china billionaires, chinese selling websites, china´s middle class, selling real estate internationally, bangkok real estate, chinese holiday 2018, year of goat, buying house in china, singapore chinese new year 2017, sites chinois, chinese holiday 2016, golden week china 2015, juwai, juwai com, juwai.com, juwaii
SOURCES:
- Sales Prices of Residential Buildings in 70 Medium and Large-sized Cities in June 2019 (National Bureau of Statistics): http://www.stats.gov.cn/english/PressRelease/201907/t20190716_1676345.html
- China´s December home prices stay resilient as big cities rebound (Reuters): https://uk.reuters.com/article/uk-china-economy-houseprices/chinas-december-home-prices-stay-resilient-as-big-cities-rebound-idUKKCN1PA05L
- Experts: Stabilization of land, home prices is very likely prospect (China Daily): http://global.chinadaily.com.cn/a/201907/16/WS5d2d1166a3105895c2e7d937.html
- Savills: China 70 cities first hand residential price index update (Savills): https://en.savills.com.cn/insight-and-opinion/savills-news/176583/savills--china-70-cities-first-hand-residential-price-index-update
- UPDATE 1-China home price growth cools in June, but investment quickens (Reuters): https://www.reuters.com/article/china-economy-property/update-1-china-home-price-growth-cools-in-june-but-investment-quickens-idUSL4N24C0IP
- Guangzhou Residential Market in Minutes - Summer 2019 (Savills): http://pdf.savills.asia/asia-pacific-research/china-research/guangzhou-research/guangzhou-residential/19q2-gz-residential-en.pdf
- Shenzhen Residential Market in Minutes - Summer 2019 (Savills): http://pdf.savills.asia/asia-pacific-research/china-research/shenzhen-research/shenzhen-residential/19q2-sz-residential-en.pdf
- Savills Q2/2019 Shanghai Property Market Overview (Savills): https://www.savills.com.vn/insight-and-opinion/savills-news/175991/savills-q2-2019-shanghai-property-market-overview
- Beijing Residential Sales Market in Minutes - Summer 2019 (Savills): http://pdf.savills.asia/asia-pacific-research/china-research/beijing-research/beijing-residential/19q2-bj-resi-sales-en.pdf
- 2019 off to a strong start after a number of en bloc deals close in the first quarter (JLL): https://www.joneslanglasalle.com.cn/en/newsroom/1q19-beijings-property-market-review
- China Real Estate Market Outlook in 2019: A Complete Overview (Asia Property HQ): https://www.asiapropertyhq.com/china-real-estate-market/
- Emerging CBDs see strong demand (JLL): https://www.joneslanglasalle.com.cn/en/newsroom/shanghai-property-review-2019q1
- China Monetary Policy Report Quarter One, 2019 (People´s Bank of China (PBOC)): http://www.pbc.gov.cn/en/resource/cms/2019/06/2019061317081066820.pdf
- China Monetary Policy Report Quarter Four, 2018 (People´s Bank of China (PBOC)): http://www.pbc.gov.cn/en/resource/cms/2019/03/2019032115562784220.pdf
- Total credit to households (core debt) - As percentage of GDP (Bank for International Settlements (BIS)): https://stats.bis.org/statx/srs/table/f3.1
- Could Rising Household Debt Undercut China’s Economy? (Federal Reserve Bank of New York): https://libertystreeteconomics.newyorkfed.org/2019/02/could-rising-household-debt-undercut-chinas-economy.html
- People’s Republic of China: Financial System Stability Assessment-Press Release and Statement by the Executive Director for People’s Republic of China (International Monetary Fund): https://www.imf.org/en/Publications/CR/Issues/2017/12/07/people-republic-of-china-financial-system-stability-assessment-45445
- The IMF Just Warned of a Potential Banking Crisis in China (Fortune): http://fortune.com/2016/10/18/china-corporate-debt-imf/
- Central bank chief says China will rein in credit after IMF rings debt alarm bell (South China Morning Post): http://www.scmp.com/news/china/policies-politics/article/2026343/central-bank-chief-says-china-will-rein-credit-after
- PBOC Orders 17 Banks to Curb Housing Loans (Caixing Global): http://english.caixin.com/2016-10-13/100996451.html
- China´s Tianjin city steps up curbs to tighten mortgage lending (Reuters): http://www.reuters.com/article/china-economy-property-idUSL4N1DT35Q
- China Steps Up Mortgage Controls in Some Property Markets (Bloomberg): https://www.bloomberg.com/news/articles/2016-11-29/china-said-to-step-up-mortgage-controls-in-some-property-markets
- Central Bank Moves Again to Curb Property Lending (Caixing Global): https://www.caixinglobal.com/2017-03-22/101068816.html
- China tightens loan rules to cool Beijing´s property market (China Daily): http://www.chinadaily.com.cn/business/2017-03/24/content_28662019.htm
- China´s Tamping Down Property Prices As Mortgage Debt Presents Risks (Forbes): https://www.forbes.com/sites/sarahsu/2017/09/27/chinas-tamping-down-property-prices-as-mortgage-debt-presents-risks/#1579c8b845a2
- China sticks to tight property market regulation (China Daily): http://www.chinadaily.com.cn/a/201806/13/WS5b20b4afa31001b825720e75.html
- Exclusive: Regulator to Inspect Banks’ Property Loans to Curb Risks (Caixing Global): https://www.caixinglobal.com/2019-07-23/exclusive-regulator-to-inspect-banks-property-loans-to-curb-risks-101442535.html
- Beijing Residential Leasing Market in Minutes - Spring 2019 (Savills China): http://pdf.savills.asia/asia-pacific-research/china-research/beijing-research/beijing-residential/19q1-bj-resi-leasing-en.pdf
- Shanghai Residential Leasing Market in Minutes - Spring 2019 (Savills China): http://pdf.savills.asia/asia-pacific-research/china-research/shanghai-research/shanghai-residential/19q1-sh-resi-l-en.pdf
- China posts its lowest quarterly growth in 27 years as the trade war drags on (CNBC): https://www.cnbc.com/2019/07/15/china-economy-beijing-posts-q2-gdp-amid-trade-war-with-us.html
- GDP grows 6.6% in 2018 (Global Times): http://www.globaltimes.cn/content/1136568.shtml
- Consumer Prices for June 2019 (National Bureau of Statistics): http://www.stats.gov.cn/english/PressRelease/201907/t20190710_1675307.html
- China increases urban employment (The Telegraph): https://www.telegraph.co.uk/peoples-daily-online/business/china-employment-figures-2019/
- China´s jobs market remains stable (Xinhua.net): http://www.xinhuanet.com/english/2019-07/15/c_138228496.htm
- Consumer Prices for June 2019 (National Bureau of Statistics of China (NBS)): http://www.stats.gov.cn/english/PressRelease/201907/t20190710_1675307.html
- China’s 2019 economic growth forecast cut by IMF as risks and uncertainties of US trade war remain (South China Morning Post): https://www.scmp.com/economy/china-economy/article/3013260/chinas-2019-economic-growth-forecast-cut-imf-risks-and
- Trade war: US-China trade battle in charts (BBC): https://www.bbc.com/news/business-48196495
- Huawei CFO Meng Wanzhou arrested in Canada, faces extradition to United States (CNN): https://edition.cnn.com/2018/12/05/tech/huawei-cfo-arrested-canada/index.html
- Truce in US-China trade war as 2 rivals seek breakthrough (The Associated Press): https://www.apnews.com/e65bb15053cb437794a464a597ee565f
- Why Huawei and its CFO Meng Wanzhou are caught up in the US-China trade war (South China Morning Post): https://www.scmp.com/tech/big-tech/article/2177648/huawei-why-chinese-telecoms-giant-and-its-cfo-are-caught-middle-china
China - More data and information
- Chinese house prices, rents, and letting income - real data!
- How expensive are houses in ChiHow expensive are houses in How expensive are houses in China, compared to the rest of Asia?, compared to the rest of A
- How much rent can be earned from China property, compared to the rest of Asia?
- Where to by property in China