Portugal's Residential Property Market Analysis 2026
Portuguese house prices are still setting records, but the pace of growth has slowed on every measure, sales volumes are falling, and credit conditions have tightened after a second ECB rate hike and a stricter limit on borrowers' debt-service ratios. At the same time, asking rents have turned back up after a sharp correction earlier this year.
This extended overview from Global Property Guide covers key aspects of the Portuguese housing market and takes a closer look at its most recent developments and long-term trends.
Table of Contents
- Property Prices and Price Index
- Historic Perspective
- Property Demand Trends
- Property Supply Trends
- Rental Market: Rents and Rental Yields
- Mortgage Market and Interest Rates
- Economic and Social Factors
Property Prices and Price Index
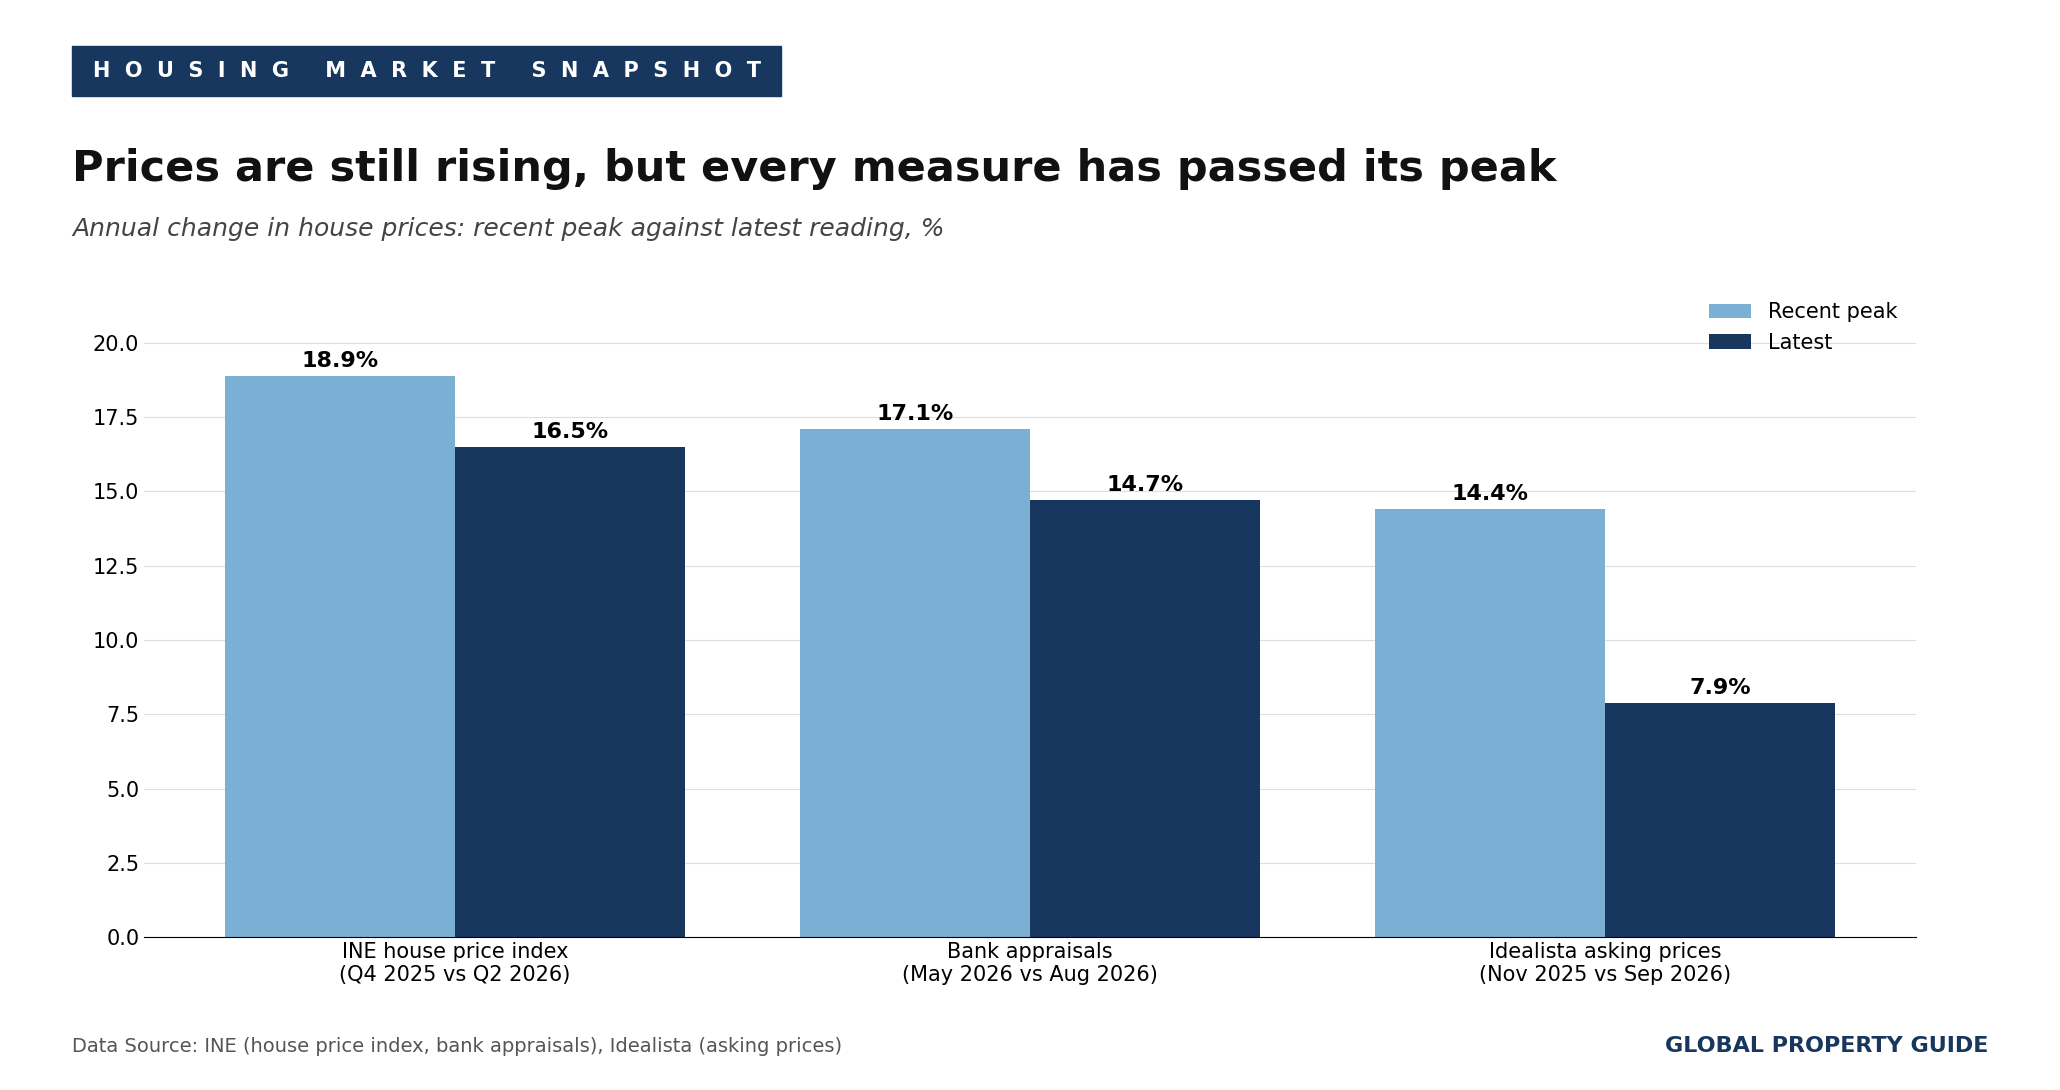
Portugal's housing market is still rising, but it has clearly passed its peak rate of growth. In August 2026, the median bank appraisal value for residential properties reached a record EUR 2,254 (USD 2,626) per square meter, according to Statistics Portugal (INE). The annual increase, however, slowed to 14.7%, from 15.2% in July and 17.1% in May.
Portugal's house price annual change:
The official house price index tells the same story. INE reported that house prices rose 16.5% year-on-year in Q2 2026, down from 17.8% in Q1 2026 and 18.9% in Q4 2025. This was the second consecutive quarter of deceleration, although prices still rose 3.6% from the previous quarter. Existing homes continued to outpace new homes, with annual increases of 18.0% and 12.3%, respectively.
By property type, the median appraisal value for apartments reached EUR 2,655 (USD 3,094) per square meter in August 2026, up 17.0% year-on-year, while houses/villas rose 12.6% to EUR 1,610 (USD 1,876) per square meter. Greater Lisbon and the Algarve remained the most expensive regions for both types, while the Center and Alentejo were the cheapest. The strongest annual increase across all dwellings was in the Setubal Peninsula (20.2%), and no region recorded a decline.
| Median bank appraisal value of residential properties by region, August 2026: | ||||
| Apartments, EUR/sqm |
Apartments, USD/sqm |
Houses, EUR/sqm |
Houses, USD/sqm |
|
| Greater Lisbon | 3,487 | 4,063 | 2,918 | 3,400 |
| Algarve | 3,010 | 3,507 | 2,770 | 3,228 |
| Alentejo | 1,771 | 2,064 | 1,299 | 1,514 |
| Center | 1,750 | 2,039 | 1,169 | 1,362 |
| Portugal | 2,655 | 3,094 | 1,610 | 1,876 |
| Note: Exchange rate EUR 1 = USD 1.1652 (ECB reference rate, 9 September 2026), applied throughout this article. | ||||
| Data source: INE, as reported by Lusa. | ||||
Transaction-price data points the same way. According to INE's local housing price statistics, the median price of dwellings sold in Portugal reached EUR 2,337 (USD 2,723) per square meter in Q1 2026, up 19.8% year-on-year, while the number of transactions fell 10.5%. Greater Lisbon (EUR 3,836 per square meter), the Algarve (EUR 3,352) and the Setubal Peninsula (EUR 2,996) were the most expensive sub-regions, and the municipality of Lisbon topped the ranking at EUR 5,292 per square meter.
Asking prices have flattened since the spring. According to Idealista, the median asking price for residential properties in Portugal reached a record EUR 3,228 (USD 3,761) per square meter in September 2026, but the annual increase has nearly halved from 14.4% in November 2025 to 7.9%, and prices rose only 0.5% over the third quarter. Lisbon remained the most expensive city at EUR 6,256 (USD 7,289) per square meter, but recorded the slowest increase of all 20 district capitals (4.4%). Porto followed at EUR 4,346 (USD 5,064) per square meter.
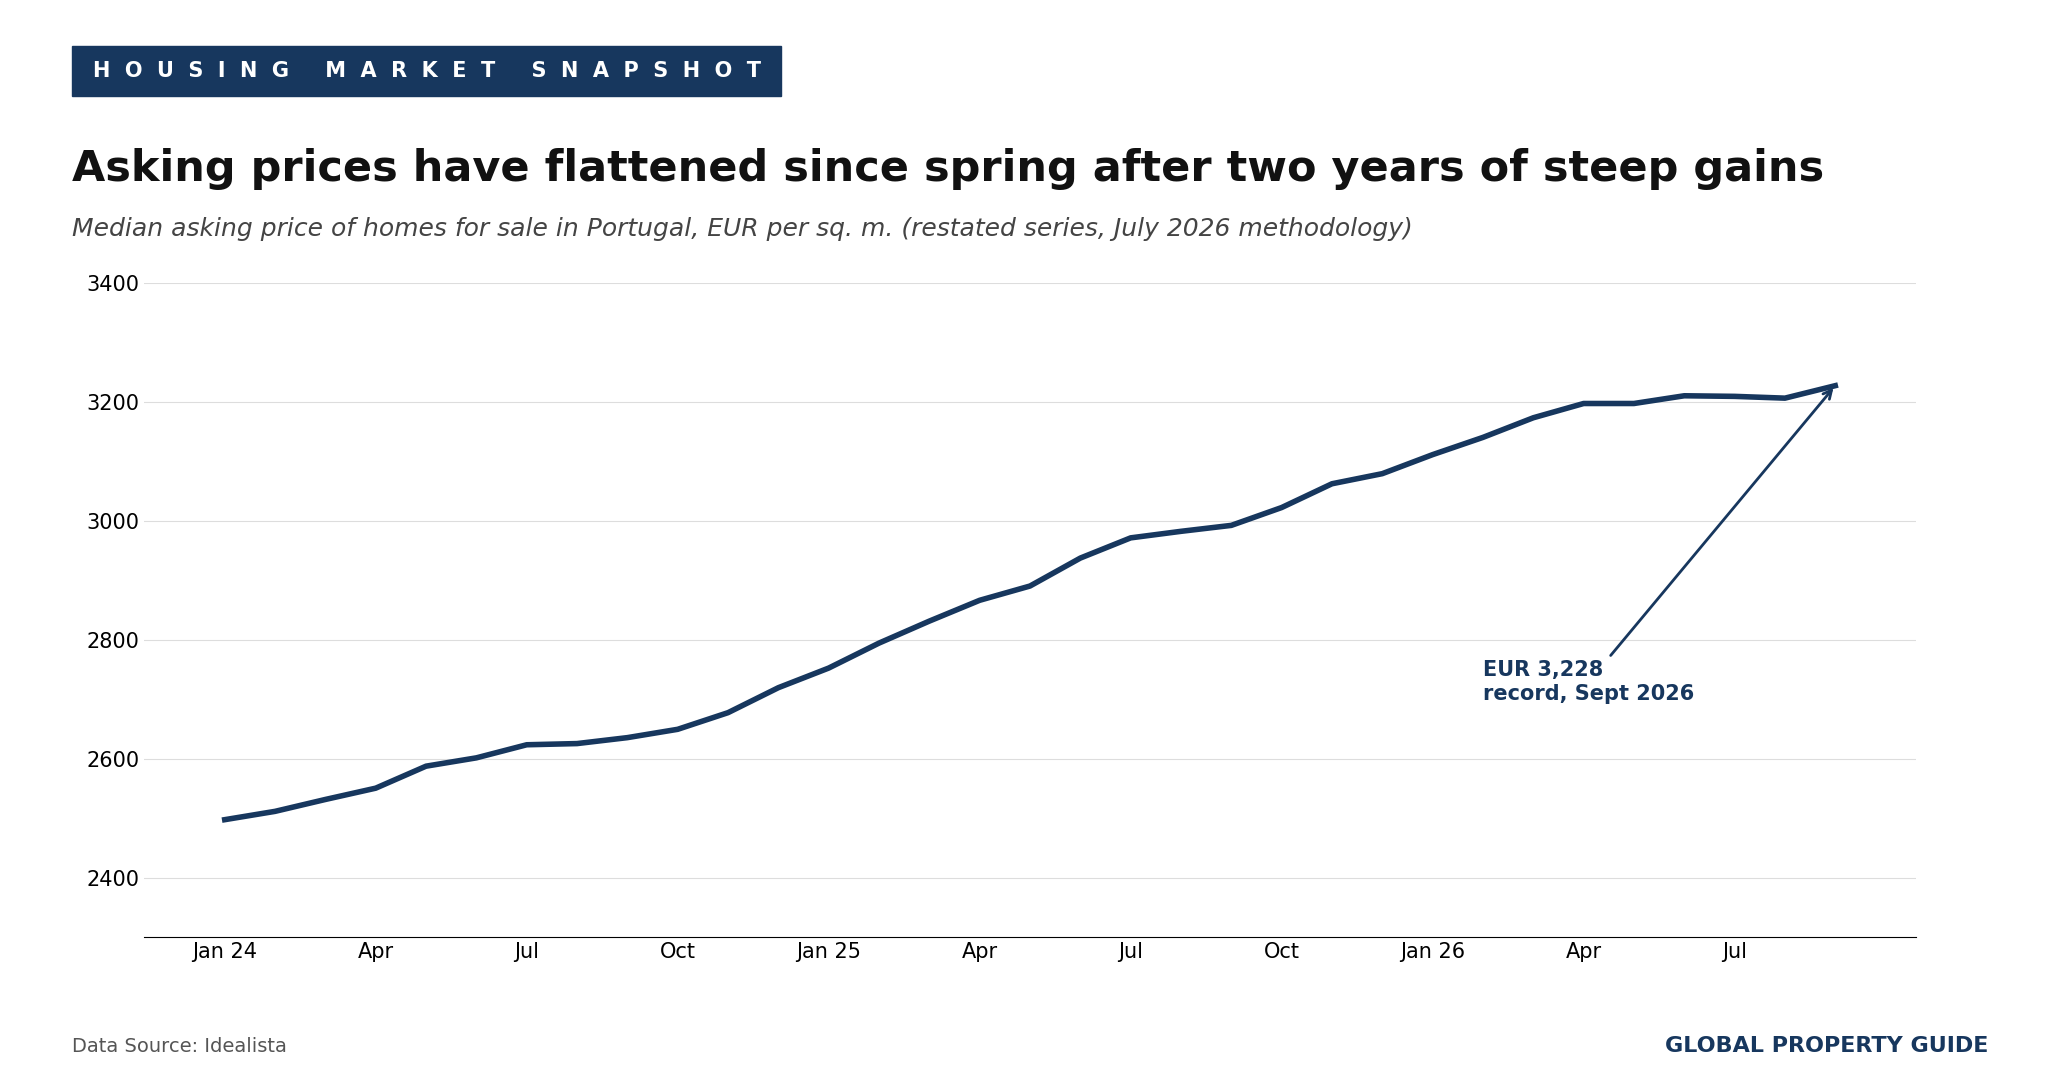
Note on revisions: Idealista changed its methodology in July 2026, excluding holiday and seasonal listings and tightening its outlier filters, and restated its entire history. Its May 2026 asking price, which our previous edition reported as EUR 3,142 per square meter (up 10.2%), now stands at EUR 3,198 (up 10.6%). All Idealista figures in this edition use the restated series. Our previous edition also used four different EUR/USD rates (1.1706, 1.1673 and, without disclosure, about 1.163 and 1.130); this edition applies a single rate throughout.
Looking ahead, the forces that pushed prices up remain in place, but the brakes are now visible. Banco de Portugal's stricter borrower limits took effect in August, the ECB has raised rates twice since June, and sales have fallen for two consecutive quarters. Prices are likely to keep rising for now, given the structural shortage of homes, but at a markedly slower pace than in 2025.
Historic Perspective
Foreign demand and cheap credit drove the boom
Between 2015 and 2024, Portugal's housing market underwent one of the most pronounced periods of growth in Europe. National house prices more than doubled, with the largest increases in Lisbon, Porto and coastal regions. The expansion was driven by foreign investment, supported by the Golden Visa program and the Non-Habitual Resident tax regime, as well as by the growth of tourism and short-term rentals. Persistently low interest rates further facilitated borrowing.
Housing supply did not keep up. Annual completions averaged slightly above 16,000 units, as new development was held back by administrative delays, labor shortages, rising construction costs and complex regulations.
Policy shifted toward supply
Successive governments responded with measures aimed at increasing supply. The government is targeting 59,000 public homes by 2030, with an overall investment of EUR 4.2 billion, and planning rules have been adjusted to let municipalities reclassify some rural land for housing. On the demand side, real estate was removed from the Golden Visa program in 2023, and the Non-Habitual Resident regime was closed to new entrants from January 2024.
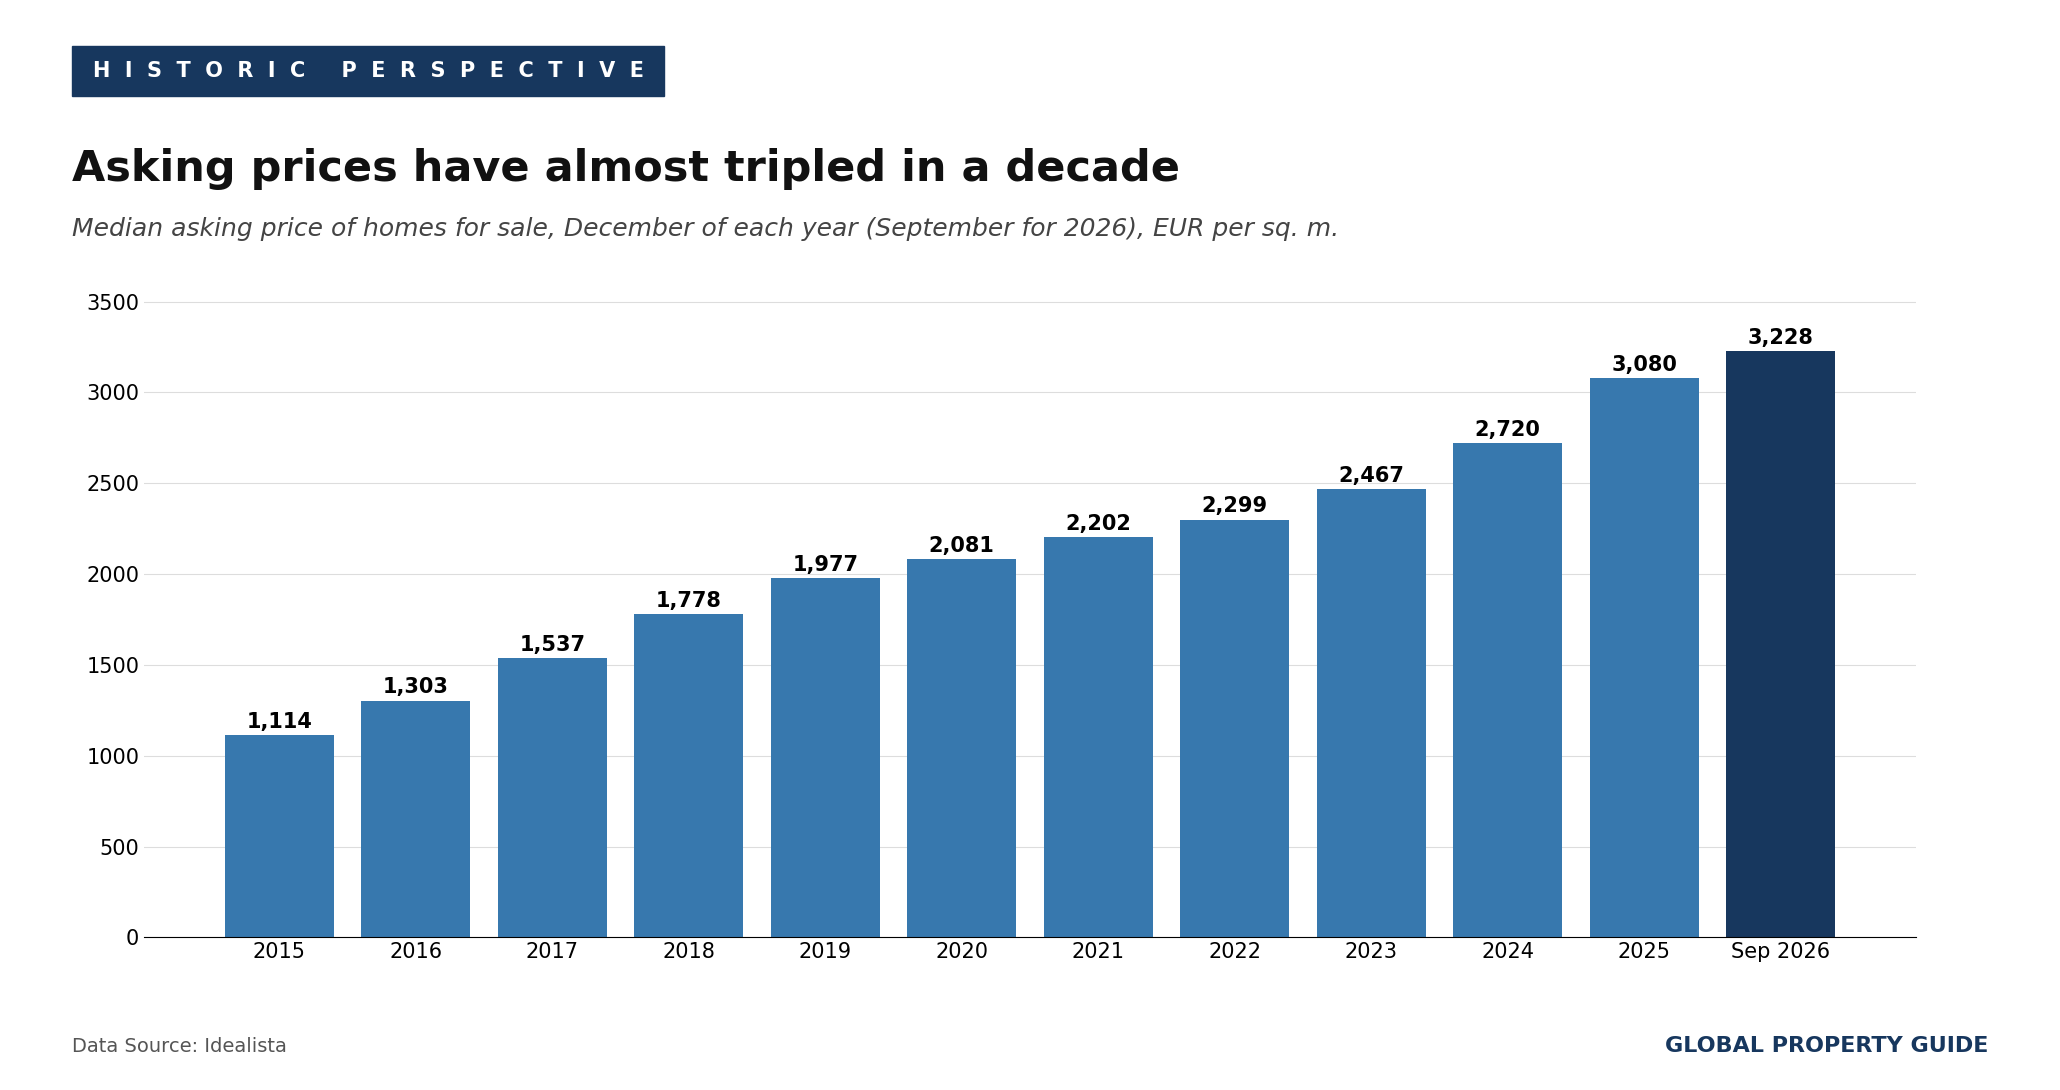
Despite these interventions, the gap between supply and demand has persisted. Idealista's restated series shows the median asking price rising from EUR 1,114 per square meter in December 2015 to EUR 3,080 in December 2025, and to EUR 3,228 by September 2026, close to a threefold increase.
Property Demand Trends
Record 2025 gives way to two quarters of decline
Portugal's residential demand peaked in 2025. According to INE, 169,812 dwellings were sold nationwide during the year, up 8.6% and the highest in the available series, while the total value of transactions rose 21.7% to EUR 41.2 billion.
That momentum has now reversed. INE reported that 40,142 dwellings were sold in Q2 2026, down 6.4% from a year earlier. INE's local price statistics had already shown a 10.5% annual fall in Q1 2026. Every region recorded fewer sales, with the smallest declines in Alentejo (-0.8%) and the Setubal Peninsula (-2.1%) and the largest in Madeira (-15.2%) and the Algarve (-12.4%). Because prices kept rising, the value of transactions still increased 4.2% to EUR 10.7 billion (USD 12.5 billion).
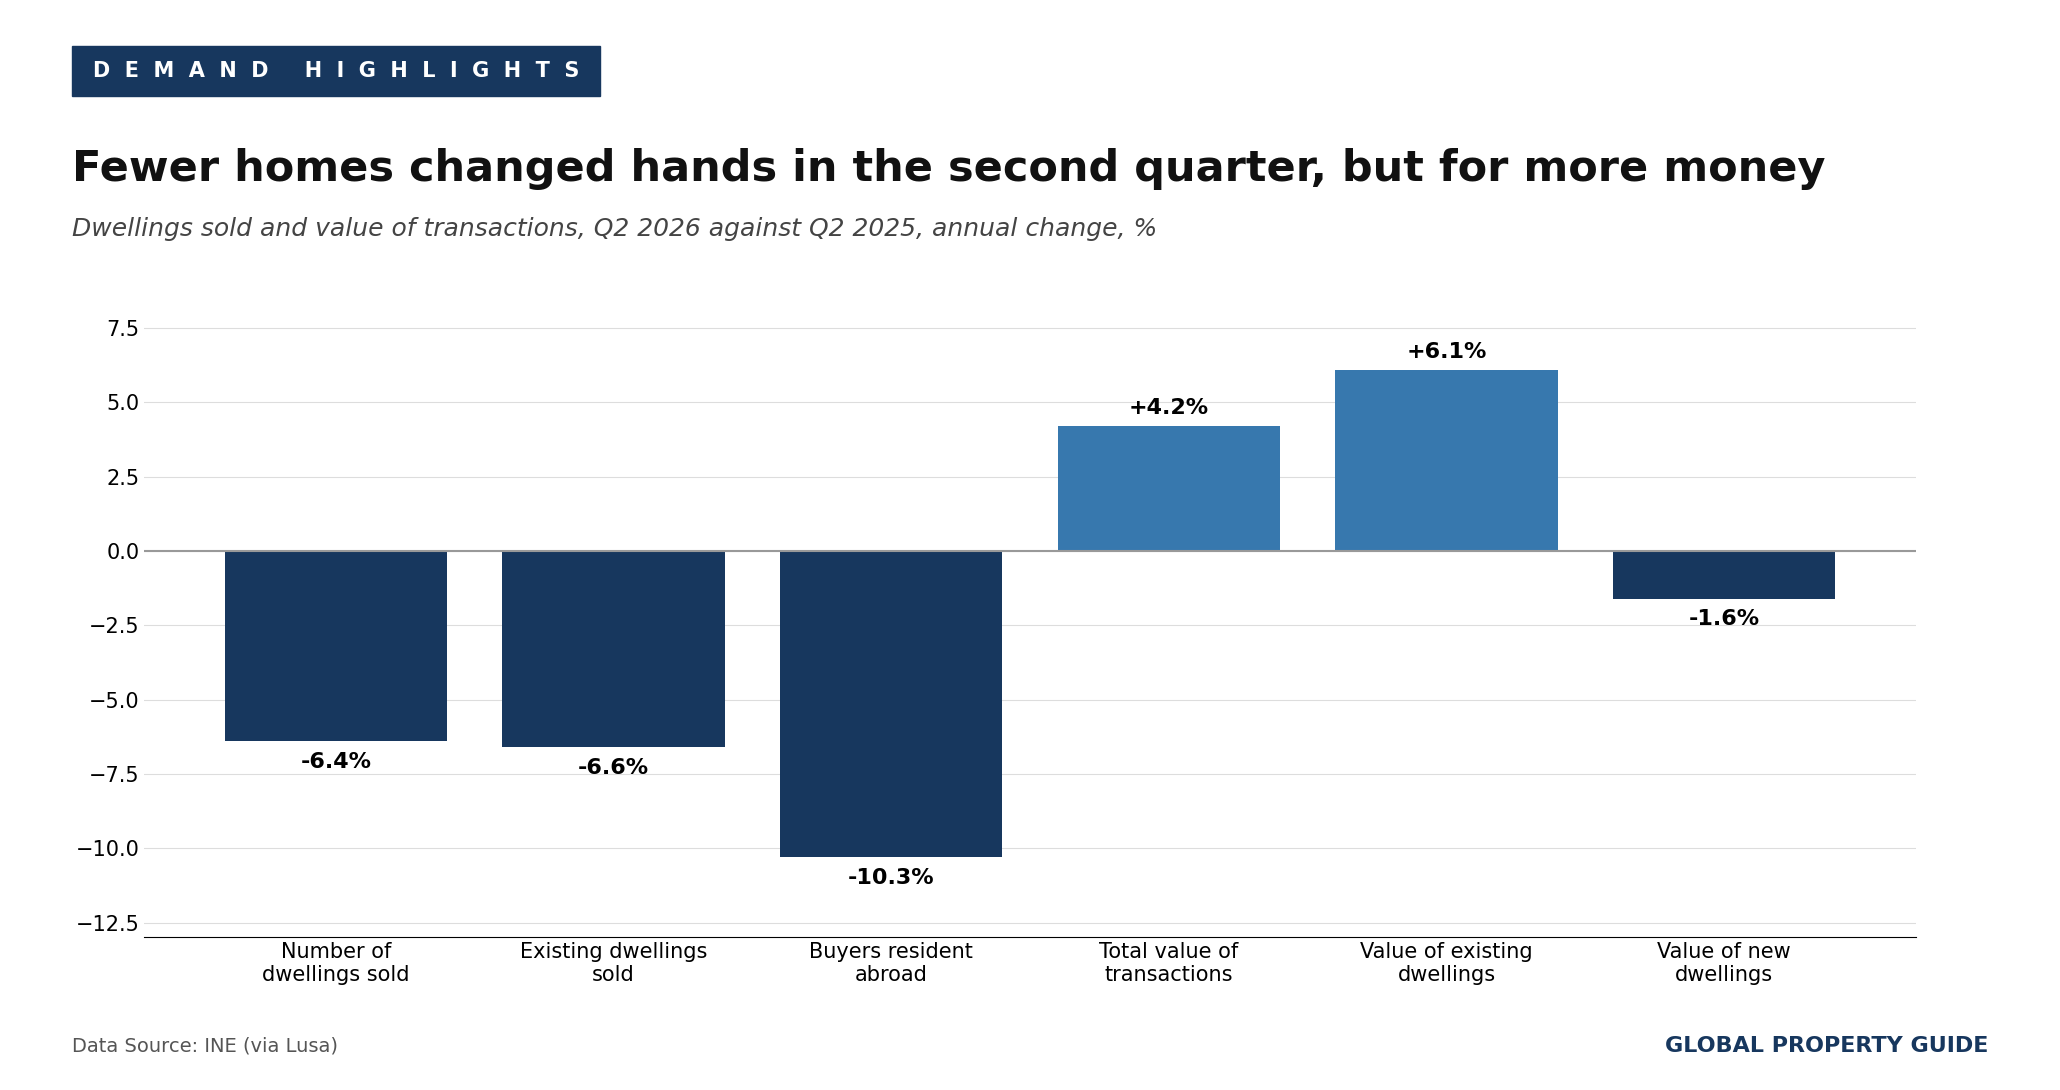
Existing dwellings accounted for 32,307 sales, or 80.5% of the total, down 6.6% year-on-year. Buyers with tax residence in Portugal purchased 38,252 dwellings (95.3% of the total), down 6.2%, while purchases by buyers resident abroad fell 10.3% to 1,890.
Non-resident demand keeps shrinking
Purchases by non-resident buyers declined for the third consecutive year in 2025 and fell again in Q2 2026. In 2025, EU-resident buyers acquired 4,416 dwellings (down 9.6%) and buyers resident outside the EU purchased 4,055 (down 17.1%). Idealista noted that the end of the Golden Visa real estate route and the replacement of the Non-Habitual Resident regime help explain the trend.
| Number of dwellings sold by region, 2025: | ||||
| New dwellings sold | YoY, % | Existing dwellings sold | YoY, % | |
| Continental Portugal | 32,377 | 7.29% | 131,467 | 9.95% |
| North | 12,531 | 4.99% | 38,136 | 10.78% |
| Center | 5,364 | 12.15% | 22,103 | 10.15% |
| West and Tagus Valley | 3,245 | 18.65% | 12,870 | 10.48% |
| Greater Lisbon | 5,207 | 2.04% | 26,555 | 5.97% |
| Setubal Peninsula | 2,458 | 4.86% | 14,030 | 11.35% |
| Alentejo | 1,186 | 19.68% | 7,675 | 11.73% |
| Algarve | 2,386 | 4.33% | 10,098 | 13.50% |
| Autonomous Region of the Azores | 414 | -16.87% | 2,251 | -0.49% |
| Autonomous Region of Madeira | 776 | -35.55% | 2,527 | -3.40% |
| Portugal | 33,567 | 5.29% | 136,245 | 9.48% |
| Data source: INE. | ||||
Outlook: weaker volumes
The near-term outlook for sales volumes has weakened. Banks surveyed by Banco de Portugal expected demand for housing loans to decline and credit standards to tighten further in Q3 2026, and the country's largest lenders told reporters in August that the new borrower limits will reduce new mortgage production. Underlying housing need remains strong, but affordability, higher interest rates and tighter credit are likely to keep transactions below their 2025 levels in the coming quarters.
Property Supply Trends
Completions at a 14-year high in 2025
New housing delivery improved in 2025, although from a low base. According to INE, 26,714 dwellings in new construction for family housing were completed during the year, up 5.5% and the highest since 2011, while 42,048 dwellings were licensed, up 21.4%.
| Residential construction activity by region, 2025: | ||||
| Dwellings completed | YoY, % | Dwellings licensed | YoY, % | |
| Continental Portugal | 25,358 | 6.35% | 40,316 | 22.51% |
| North | 12,092 | 14.08% | 19,041 | 21.17% |
| Center | 3,999 | 6.70% | 6,806 | 34.13% |
| West and Tagus Valley | 1,925 | -6.55% | 3,297 | 25.03% |
| Greater Lisbon | 3,304 | 14.40% | 6,406 | 49.18% |
| Setubal Peninsula | 2,250 | 7.97% | 2,065 | -14.49% |
| Alentejo | 626 | -4.57% | 891 | -17.65% |
| Algarve | 1,162 | -35.73% | 1,810 | 6.97% |
| Autonomous Region of the Azores | 422 | -22.00% | 752 | 14.81% |
| Autonomous Region of Madeira | 934 | 0.86% | 980 | -8.75% |
| Portugal | 26,714 | 5.54% | 42,048 | 21.40% |
| Data source: INE. | ||||
Licensing still rising in 2026
Licensing continued to grow this year. The construction federation AICCOPN reported that 22,216 new dwellings were licensed in the first half of 2026, up 4.0% year-on-year, even though the number of projects licensed fell 6.9%. In Q2 2026 alone, the number of dwellings licensed in new construction for family housing rose 10.8% year-on-year, according to INE data compiled by the building materials association APCMC, with the North accounting for 48% of the total.
Why licences overstate the pipeline
Licence numbers likely overstate the homes that will actually be built. APCMC cautions that output of roughly 25,000 dwellings a year cannot realistically jump above 40,000 when construction employment is growing only around 2.5% a year. It adds that a significant share of licences is going unused, with projects delayed by financing difficulties or re-licensed in 2026 to qualify for the reduced 6% VAT rate on residential construction approved in March 2026, which inflates this year's licensing figures. Rising interest rates and tighter credit could also make it harder to sell projects already under way and to finance new ones.
Portugal's residential supply is therefore improving only gradually. New supply should increase, but not quickly enough to close the structural housing shortage in the near term.
Rental Market: Rents and Rental Yields
Asking rents reverse their correction
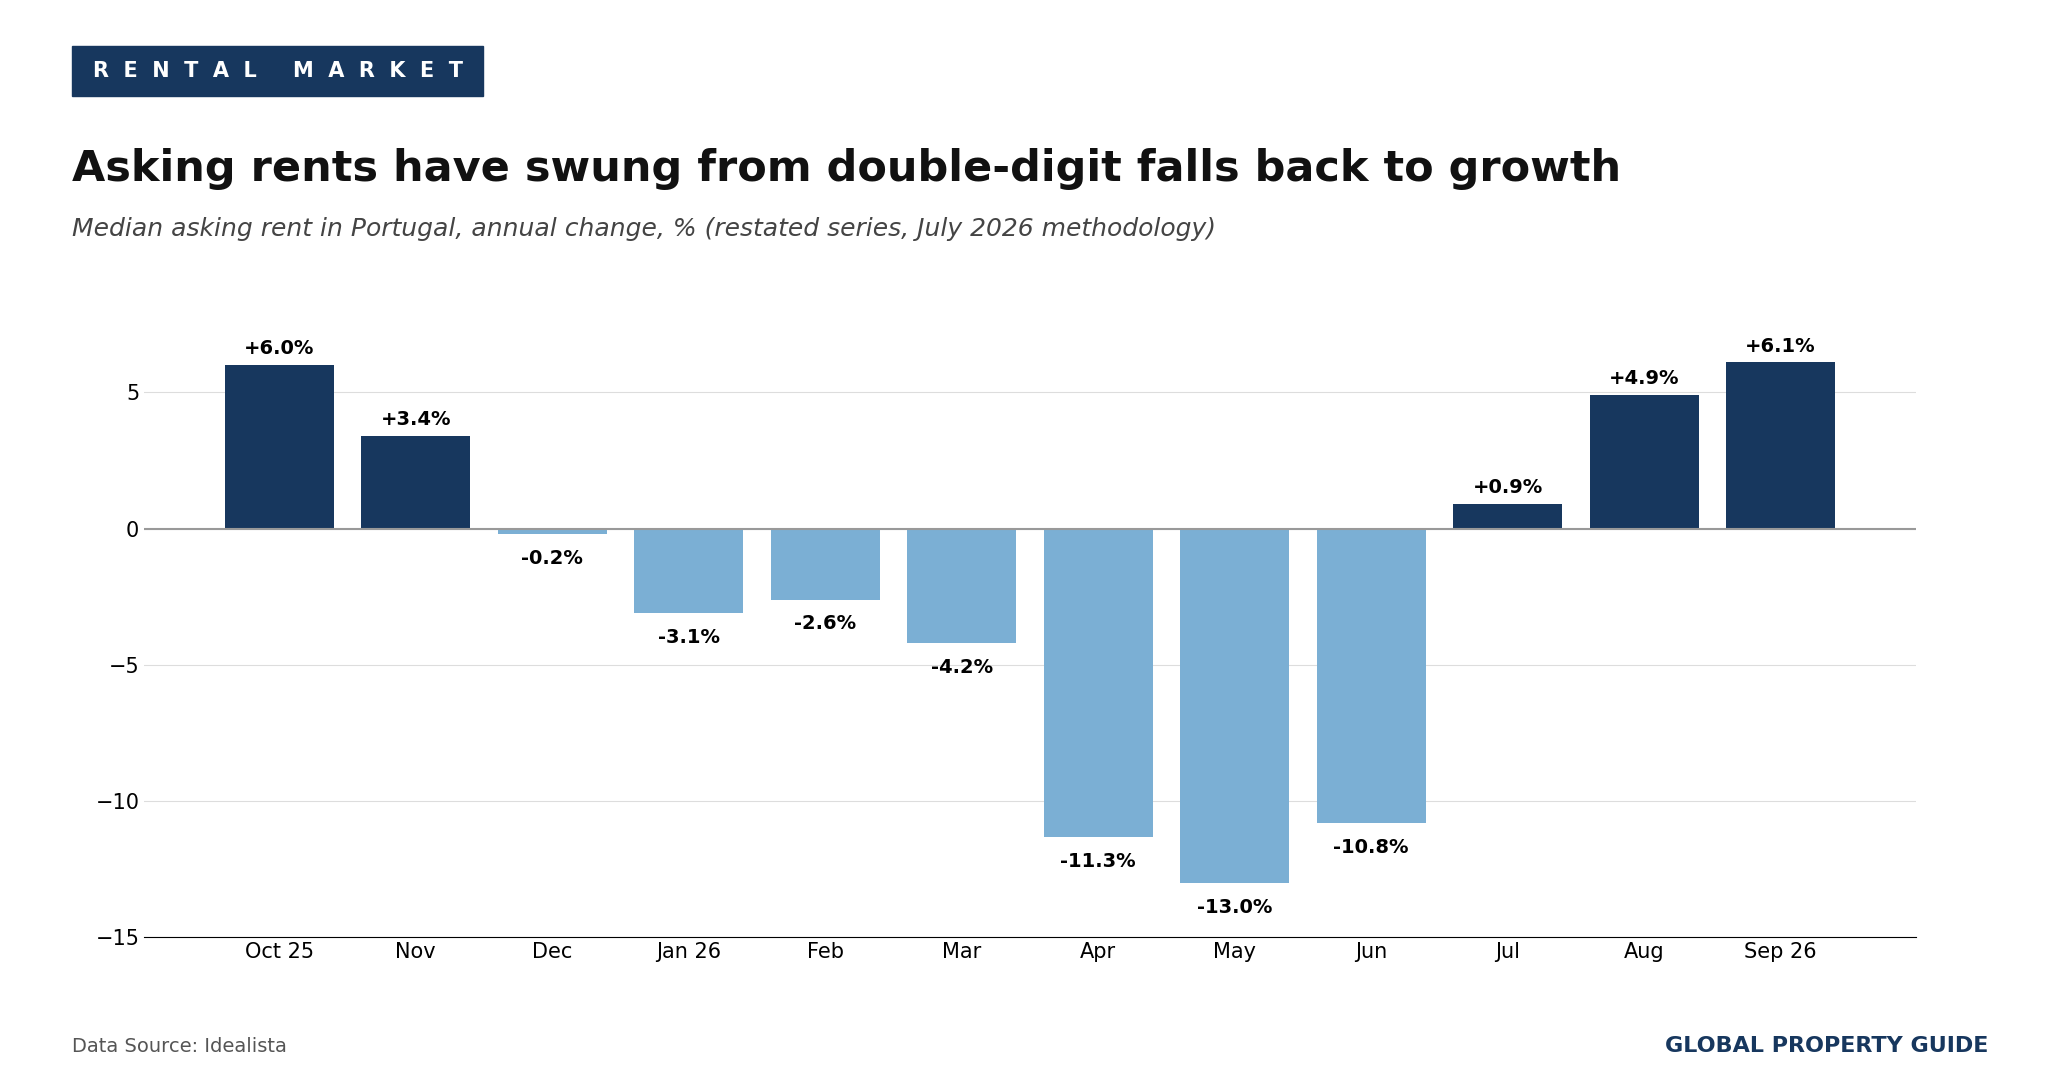
Asking rents in Portugal have turned upward again. Based on properties listed on Idealista, the median asking rent rose 6.1% year-on-year in September 2026 to EUR 18.3 (USD 21.3) per square meter, the third consecutive month of annual increases. This follows a sharp correction in the first half of the year: under Idealista's restated series, asking rents were down 13.0% year-on-year in May 2026, a much steeper fall than the 2.9% decline reported under the old methodology and cited in our previous edition. Despite the rebound, rents remain 1.4% below their May 2025 peak.
Rents rose in 13 of the 16 district and regional capitals analyzed. The largest annual increases were in Aveiro (22.1%), Viana do Castelo (17.5%) and Braganca (12.6%), while Lisbon rents rose 8.8%. Rents fell in Faro (-12.6%), Coimbra (-5.9%) and Porto (-4.4%). At the regional level, the North was the only region where rents declined (-5.3%).
| Median asking rents in selected cities, September 2026: | |||
| EUR/sqm | USD/sqm | YoY, % | |
| Lisbon | 25.1 | 29.2 | 8.8% |
| Porto | 19.0 | 22.1 | -4.4% |
| Funchal | 16.8 | 19.6 | 7.4% |
| Faro | 14.8 | 17.2 | -12.6% |
| Aveiro | 14.4 | 16.8 | 22.1% |
| Setubal | 13.7 | 16.0 | 5.3% |
| Coimbra | 12.8 | 14.9 | -5.9% |
| Braga | 10.7 | 12.5 | 3.5% |
| Portugal | 18.3 | 21.3 | 6.1% |
| Data source: Idealista. | |||
Rents paid and new contracts
Rents actually paid by tenants have grown steadily throughout. INE reported that average housing rents per square meter rose 5.2% year-on-year in August 2026, with all regions showing increases and Madeira recording the highest (6.9%). New contracts are rising faster: after suspending its local rent statistics in late 2025 pending tax-authority data, INE resumed publication under a new methodology, showing a median rent on new leases of EUR 10.17 (USD 11.85) per square meter in Q2 2026, up 10.2% year-on-year and a record.
Portugal's rent price index:
Rent caps and the rental reform
For existing contracts, the statutory annual rent update for 2027 has been confirmed at 2.56%, up from 2.24% in 2026, based on average inflation excluding housing over the 12 months to August.
The government's reform of the urban lease regime (NRAU) also cleared its first parliamentary hurdle on 30 September 2026, when it was approved on general principles with the abstention of Chega. The bill would allow evictions to begin after two months of unpaid rent instead of three and let landlords request three deposits instead of two, with no cap on their value, and it would end the brake on rent increases. The text now goes to committee, where the governing PSD has committed to amendments agreed with Chega.
Rental yields
Research conducted by Global Property Guide showed gross rental yields for apartments in Portugal at an average of 4.29% in May 2026, down from 4.57% in May 2025. The highest yields among the surveyed submarkets were in Setubal (4.89%), while the lowest were in Lisbon (3.76%).
The rental market remains small. Eurostat reports the share of tenants in Portugal's population at 28.8% in 2025, below the euro area average of 34.9%.
Mortgage Market and Interest Rates
ECB raises rates again
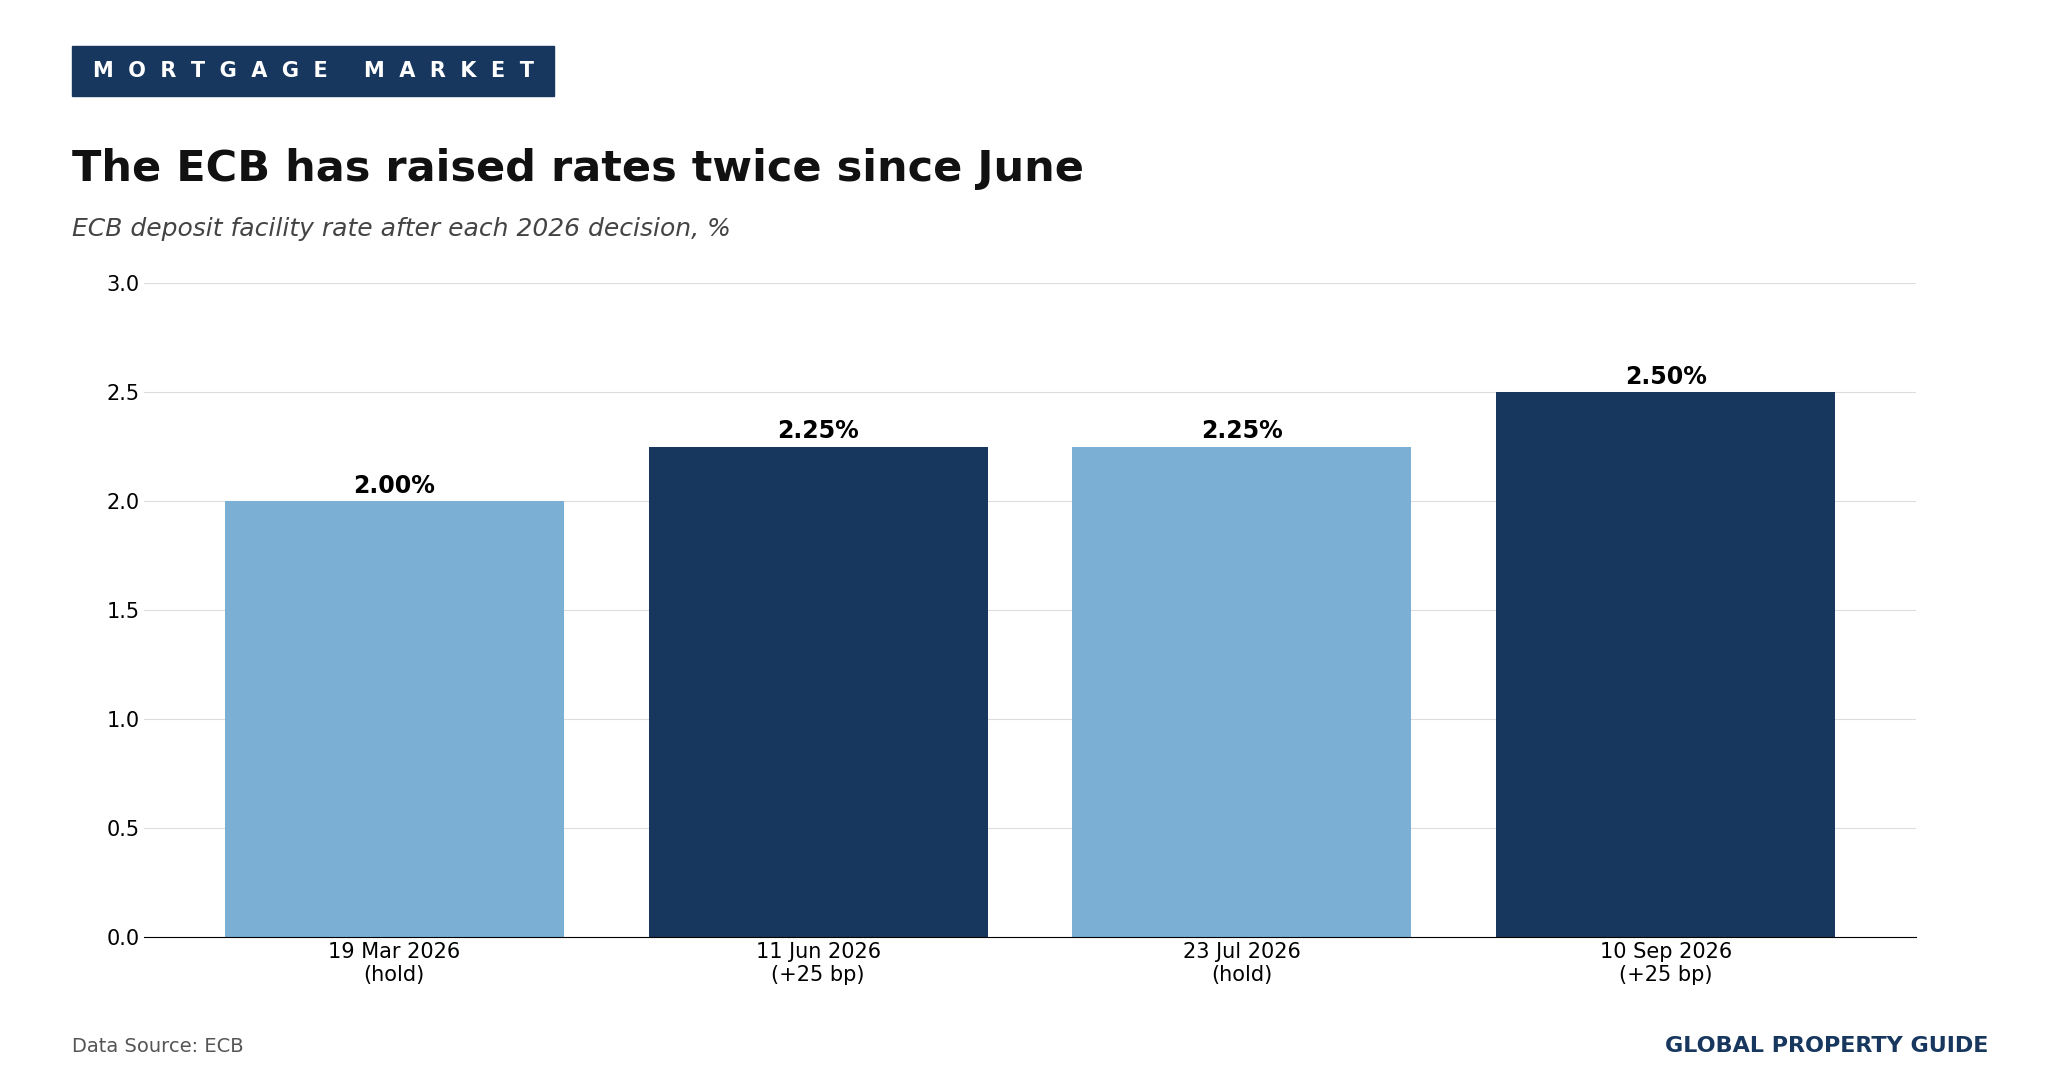
The European Central Bank raised its key interest rates by another 25 basis points on 10 September 2026, as economists had expected at the time of our previous edition. From 16 September, the deposit facility rate stands at 2.50%, the main refinancing operations rate at 2.65% and the marginal lending facility rate at 2.90%. The ECB said it will follow a data-dependent, meeting-by-meeting approach and is not pre-committing to a particular rate path.
Portugal's mortgage loan interest rates:
Because most Portuguese mortgages are linked to Euribor, higher rates feed through quickly. The average monthly instalment on outstanding housing loans rose for the 12th consecutive month in August 2026 to a record EUR 446 (USD 520), according to Banco de Portugal, up EUR 28 from a year earlier. The average rate on new housing loan contracts was 3.00%, well below the euro area average of 3.60%.
Borrowers switch to mixed rates
Borrowers have responded by moving to mixed-rate loans, which fix the rate for an initial period. Mixed-rate products accounted for a record 87% of new housing loan operations in August 2026 and now make up 49% of the outstanding stock.
| New housing loan operations by rate type, August 2026: | ||
| Share of new operations | Average interest rate | |
| Mixed rate | 87% | 2.86% |
| Variable rate | 11% | 3.23% |
| Fixed rate | 3% | 3.83% |
| Note: Shares do not sum to 100% due to rounding. | ||
| Data source: Banco de Portugal. | ||
Stricter borrower limits from August
Banco de Portugal's new macroprudential recommendation took effect on 1 August 2026. It lowers the maximum recommended debt-service-to-income ratio for new loans from 50% to 45%, tested against a 1.5 percentage point rise in interest rates, and cuts the share of lending that banks may grant above the limit from 15% to 10%. Borrowers rushed to lock in loans before the change: new housing loan contracts reached a record EUR 2,345 million (USD 2,732 million) in July, before falling by EUR 229 million in August.
In the first half of 2026, new housing credit excluding renegotiations totaled EUR 12,153 million (USD 14,161 million), up 11.3% year-on-year, according to AICCOPN, based on Banco de Portugal data.
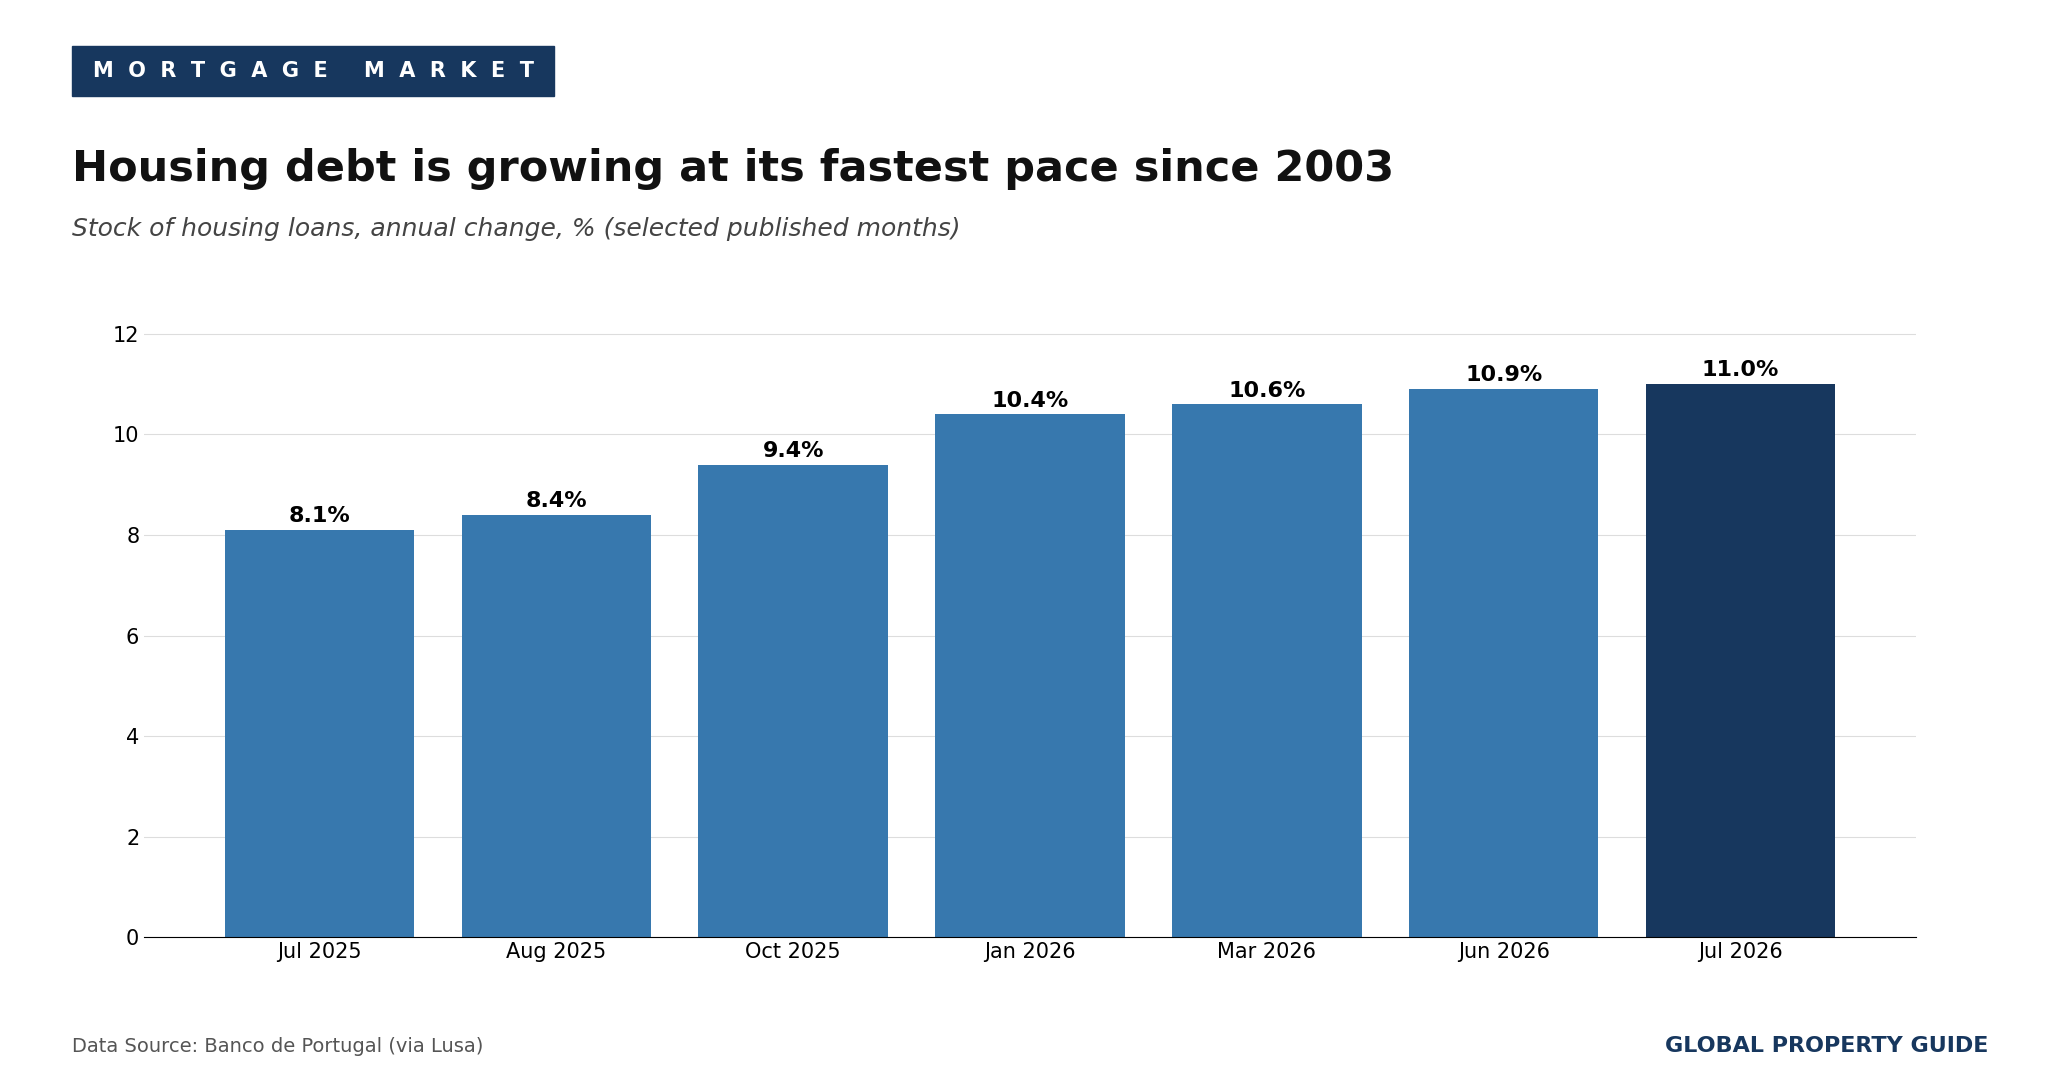
Housing debt grows at the fastest pace since 2003
The stock of housing loans reached EUR 118.0 billion (USD 137.5 billion) in July 2026, up 11.0% year-on-year and the fastest growth since February 2003, according to Banco de Portugal. This edition uses Banco de Portugal's series; our previous edition cited a different ECB series for the loan stock, so the two figures are not directly comparable. At the end of June 2026, outstanding housing loans were equivalent to about 37.0% of GDP, based on the EUR 315.9 billion of GDP generated in the four quarters to Q2 2026.
According to the most recent Eurostat figures, 31.5% of the population in Portugal lives in an owned residence with an outstanding mortgage or housing loan.
Economic and Social Factors
Growth picked up in the second quarter
Portugal's economy accelerated in Q2 2026. Real GDP grew 2.5% year-on-year and 0.8% quarter-on-quarter, double the euro area's quarterly pace, driven by private consumption, while investment declined. Q1 growth was revised up to 0.1% quarter-on-quarter, after storms in January and February weighed on activity.
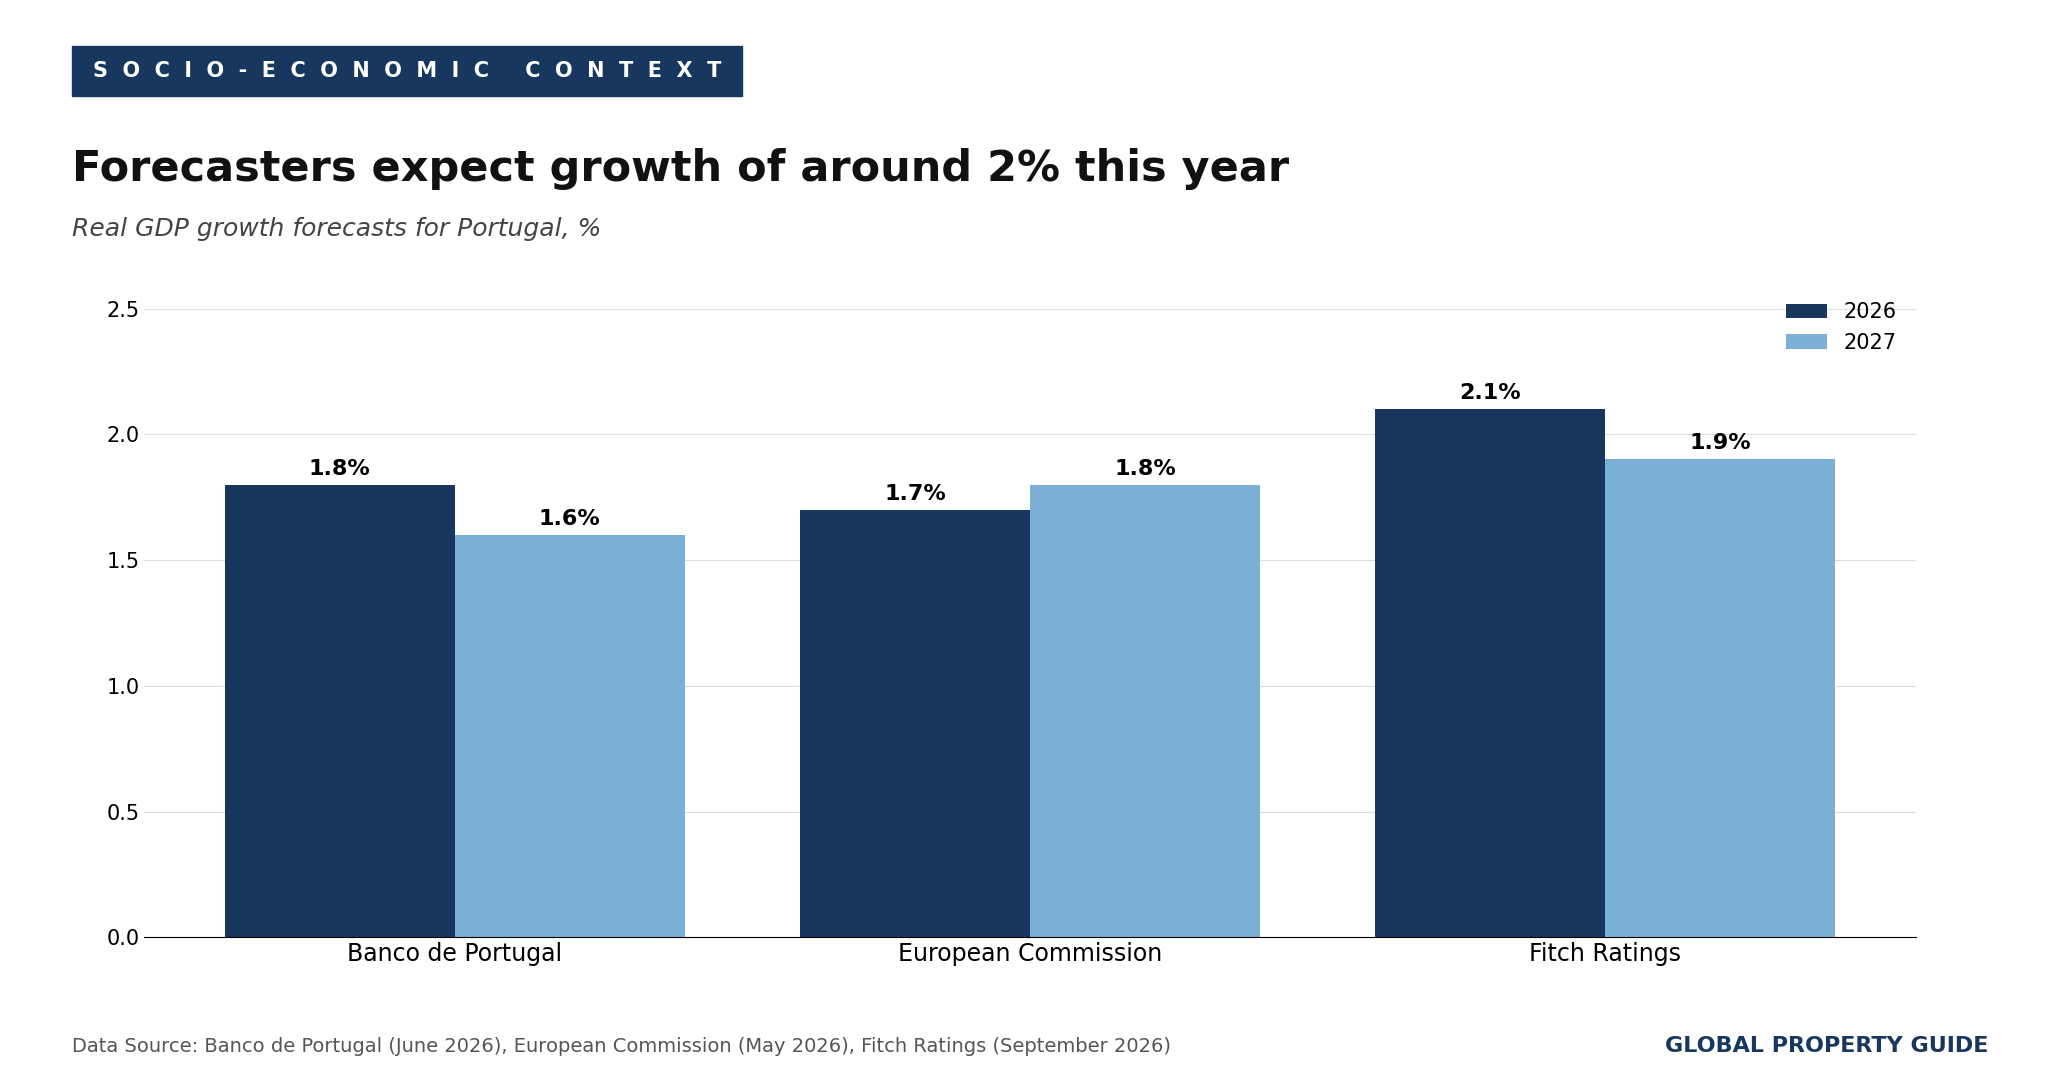
Banco de Portugal's June Economic Bulletin projects growth of 1.8% in 2026 and 1.6% in 2027, while the European Commission forecasts 1.7% and 1.8%, respectively. Fitch Ratings, which raised Portugal's sovereign rating from 'A' to 'A+' with a stable outlook on 4 September 2026, now expects growth of 2.1% this year. The upgrade followed the positive outlook Fitch assigned in March, which our previous edition reported, and reflects stronger public finances and a falling debt ratio.
Inflation is rising again
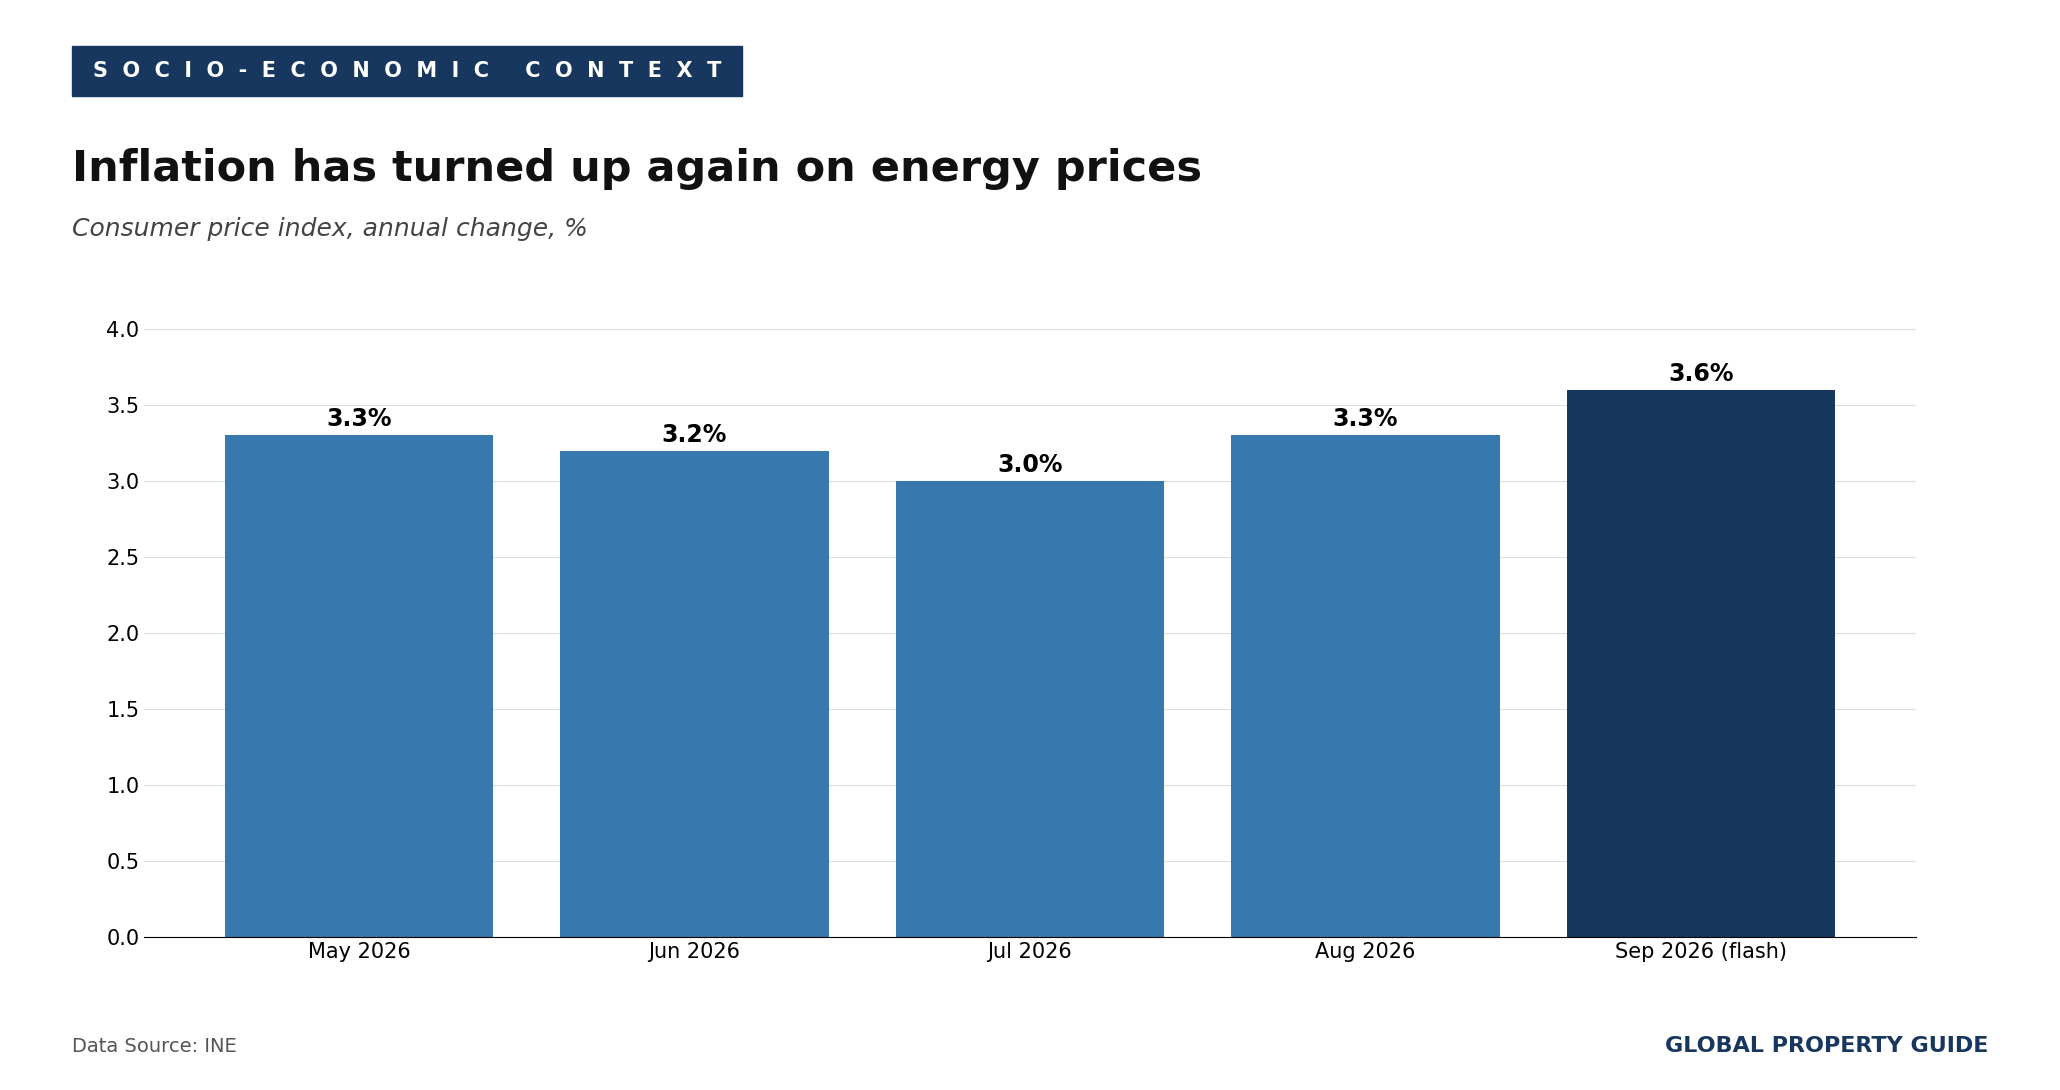
Consumer price inflation rose to 3.3% in August 2026 and, according to INE's flash estimate, to 3.6% in September, driven by higher energy prices. Banco de Portugal expects inflation to average 3.1% this year before returning toward 2%.
Labor market remains tight
The labor market remains tight. The seasonally adjusted unemployment rate stood at 5.7% in July 2026, unchanged from April and June and below the euro area average of 6.4%, while the unemployment rate for men fell to its lowest level since February 1998.
Overall, Portugal is growing faster than most of the euro area, with sound public finances and a strong labor market. However, rising energy prices, higher interest rates and the persistent housing shortage remain the main risks, and affordability pressures in Lisbon, Porto and the Algarve are unlikely to ease soon.
Sources:
- Statistics Portugal (INE)
- Survey on Bank Evaluation of Housing, August 2026: ine.pt
- House Price Index, Q2 2026 (as reported by Observador/Lusa): observador.pt
- House Price Index and transactions, Q2 2026 (as reported by Dinheiro Vivo): dinheirovivo.dn.pt
- House Price Statistics at Local Level, Q1 2026 (as reported by Idealista): idealista.pt
- House Price Index, 2025: ine.pt
- Construction: Building Permits and Completed Buildings, Q4 2025: ine.pt
- Prices and Inflation: ine.pt
- Housing Rents, August 2026 (as reported by Renascenca/Lusa): rr.pt
- Monthly Unemployment Estimates, July 2026 (as reported by Renascenca/Lusa): rr.pt
- GDP Flash Estimate, Q2 2026 (as reported by DNoticias/Lusa): dnoticias.pt
- Banco de Portugal
- Interest Rates and New Loans, August 2026 (as reported by Doutor Finanças): doutorfinancas.pt
- Housing Loan Stock, July 2026 (as reported by Human Resources Portugal/Lusa): hrportugal.sapo.pt
- Macroprudential Recommendation, August 2026 (as reported by Sabado/Lusa): sabado.pt
- Bank Lending Survey, July 2026 (as reported by Idealista): idealista.pt
- Economic Bulletin, June 2026 (as reported by Dinheiro Vivo): dinheirovivo.dn.pt
- European Central Bank (ECB)
- Monetary Policy Decisions, 10 September 2026: ecb.europa.eu
- Euro Reference Exchange Rate, US Dollar: ecb.europa.eu
- Government of the Portuguese Republic
- Statement from the Council of Ministers, March 27, 2026 (PT): portugal.gov.pt
- RRF: 10,000 Homes Delivered and Another 8,000 Will Be Available by the End of the Year: portugal.gov.pt
- Official Gazette of the Republic of Portugal (Diario da Republica)
- Decree-Law No. 117/2024, of December 30 (PT): diariodarepublica.pt
- Law No. 56/2023, of October 6 (PT): diariodarepublica.pt
- Eurostat
- Distribution of Population by Tenure Status, Type of Household and Income Group: ec.europa.eu
- Idealista
- Home Prices Rise 7.9% in September and Reach New Record (PT): news.cision.com
- Rents Accelerate to 6.1% in September (PT): idealista.pt
- Bank Appraisals: Value per sq. m. at EUR 2,254 (PT): idealista.pt
- New Housing Credit Hits Record Before Effort Rate Tightens (PT): idealista.pt
- New Rental Law Will Increase Tenants' Financial Exposure (PT): idealista.pt
- Home Sales to Non-Residents in Portugal Fall for the Third Year in a Row: idealista.pt
- AICCOPN
- Housing Statistical Summary No. 104, August 2026 (PT): aiccopn.pt
- APCMC
- Construction Sector Analysis, Q2 2026 (PT): apcmc.pt
- Fitch Ratings
- Fitch Upgrades Portugal to A+ with Stable Outlook (as reported by ECO News): econews.pt
- Other Media
- INE Confirms 2.56% Rent Increase in 2027 (Jornal de Negócios, PT): jornaldenegocios.pt
- Rental Reform Approved on General Principles (DNoticias, PT): dnoticias.pt
- Banks Expect Drop in New Lending as Rules Tighten (Observador, PT): observador.pt
- KPMG
- Portugal: Expatriate Tax Regime Ended; New Tax Incentive for Scientific Research and Innovation: kpmg.com