Panama’s Residential Property Market Analysis 2026
Despite weaker demand, attributed to challenges in the rollout of the revised preferential mortgage scheme, the Panamanian housing market continues to show signs of selective price recovery, with uneven dynamics reported across regional submarkets.
This extended overview from Global Property Guide covers key aspects of the Panamanian housing market and takes a closer look at its most recent developments and long-term trends.
Table of Contents
- Property Prices and Price Index
- Property Demand Trends
- Property Supply Trends
- Rental Market: Rents and Rental Yields
- Mortgage Market and Interest Rates
- Economic and Social Factors
Property Prices and Price Index
Panama’s residential market continued to show signs of price recovery, although pricing remains highly segmented by location, property type, and asset quality. In the absence of a single official residential house price index, the current pricing picture is best assessed through a combination of city-level asking-price benchmarks, district-level listing data, and local resale versus preconstruction indicators.
Panama's house price annual change:
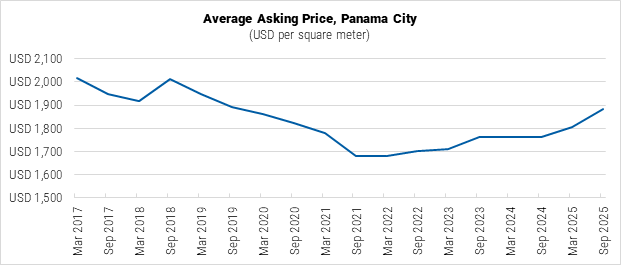
According to the latest available edition of the Real Estate Survey of Latin America (RIAL), published by the Center for Financial Research at Torcuato Di Tella University and Zonaprop, the average asking price for residential properties in the country’s capital, Panama City, reached USD 1,881 per square meter in September 2025. This represented an increase of 6.81% year-on-year and a 4.27% rise from the previously reported March 2025 reading. In regional comparison, Panama City remained relatively affordable, with its average asking price below the RIAL survey average and well below higher-priced markets such as Montevideo, Mexico City, Monterrey, Guadalajara, and Buenos Aires.
Data Source: RIAL Di Tella-Zonaprop.
More recent district-level data from Encuentra24 suggests that the price recovery continued into 2026, but remained uneven across submarkets. The strongest advertised listing price growth was recorded in Ancón, Bella Vista, San Francisco, and Juan Díaz, pointing to firmer pricing in established central areas, higher-income urban locations, and newer development corridors. Betania remained a more affordable mid-market alternative, while Casco Viejo/San Felipe continued to command the highest apartment asking price despite a year-on-year decline, reflecting the smaller and more specialized nature of the historic-district market.
Average residential asking prices in Panama City, selected districts, June 2026:
| Asking Price, Apartments, USD/sqm |
YoY change, % | Asking Price, Houses, USD/sqm |
YoY change, % | Market segment | |
| Bella Vista | USD 2,353 | 11.95% | USD 1,789 | 9.51% | Central / established urban market |
| San Francisco | USD 2,329 | 9.13% | USD 1,797 | 8.42% | Upper-middle / prime urban |
| Juan Díaz | USD 2,846 | 9.08% | USD 1,677 | -1.01% | High-end planned / newer development corridor |
| Casco Viejo, San Felipe | USD 3,998 | -5.12% | - | - | Historic / premium |
| Ancón | USD 2,422 | 18.52% | USD 1,825 | 3.15% | Low-density / international-family demand |
| Betania | USD 1,724 | 1.61% | USD 1,148 | 6.94% | Mid-market / value-oriented |
| Data Source: Encuentra24. | |||||
The clearest pricing pressure appears to be concentrated in the new-build segment. According to Panama Equity’s Q1 2026 market report, citing Galería Inmobiliaria, developer inventory in Panama City, including presale, under-construction, and recently completed units, stood at 16,311 units, the lowest level reported by the source in nine years. The same source noted that new-construction prices had risen by more than 15% over the previous 12 months. Panama Equity characterized the market as moving from a prolonged absorption phase into the early stage of a new expansion cycle, supported by declining inventory, rising rents, and renewed developer pricing power, while cautioning that this points to moderate appreciation rather than a boom.
This tightening is reflected in the gap between resale and preconstruction prices. In selected Panama City neighborhoods, preconstruction prices ranged from USD 2,800 per square meter in El Cangrejo to USD 4,300 per square meter in Casco Viejo and Punta Pacifica, while resale prices were generally lower. The largest premiums were recorded in Punta Pacifica and San Francisco, where preconstruction prices were around 95% and 84% above resale levels, respectively.
Average residential asking prices in Panama City, selected neighborhoods, Q1 2026:
| Neighborhood | Resale, USD/sqm |
Preconstruction, USD/sqm |
Preconstruction premium | 12-month resale inventory change |
| Avenida Balboa | USD 2,400 | USD 3,300 | 38% | -29.50% |
| Casco Viejo | USD 3,800 | USD 4,300 | 13% | -59.40% |
| Costa del Este | USD 2,500 | USD 3,800 | 52% | -40.20% |
| El Cangrejo | USD 1,770 | USD 2,800 | 58% | -43.20% |
| Punta Pacifica | USD 2,200 | USD 4,300 | 95% | -31.00% |
| San Francisco | USD 1,900 | USD 3,500 | 84% | -38.00% |
| Santa Maria | USD 2,900 | USD 3,800 | 31% | -52.40% |
| Data Source: Galleria Inmobiliario via Panama Equity Real Estate. | ||||
Overall, the available evidence points to a selective recovery rather than a broad-based market upswing. Panama City remains relatively affordable in regional comparison, while local listing data shows positive price momentum across most tracked districts. The strongest support is concentrated in better-located and newer stock, where tighter resale availability, higher replacement costs, and stronger developer pricing are sustaining a clear premium for preconstruction units. However, affordability constraints and policy changes remain relevant risks, particularly in the new-housing segment, where local sector views remain divided on the potential impact of the 2% property transfer tax on new homes.
Panama’s broader residential appeal is also supported by its dollarized monetary framework and established residency routes for international buyers. The official currency, the Balboa (PAB), is maintained at parity with the US dollar, while the US dollar circulates freely in commercial and financial transactions. Among the key residency programs attracting international buyers to Panama is the Pensionado Visa, which grants permanent residency to retirees with a lifetime pension of at least USD 1,000 per month. This threshold may be reduced to USD 750 for applicants who acquire Panamanian property valued at USD 100,000 or more. Foreign nationals who do not qualify under this program may apply for residency as Qualified Investors, which requires a minimum real estate investment of USD 300,000, either through direct purchase or a promesa de compraventa (purchase agreement), provided the investment is maintained for at least five years. The country further benefits from a territorial tax system, under which income earned outside the country is not subject to local income tax.
Property Demand Trends
Demand Weakens Further as Mortgage Access Tightens
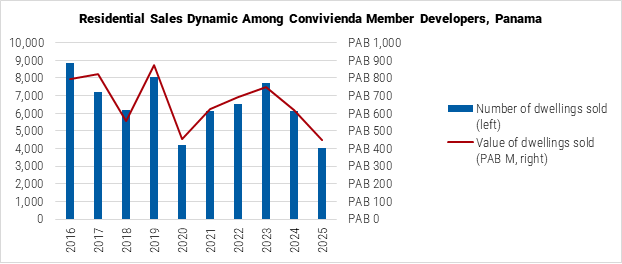
Residential demand among member developers of Convivienda (National Council of Housing Developers) weakened further in 2025, as reduced bank participation and uncertainty around housing-support measures weighed on the segments that drive most new-home sales. Participating developers reported 4,020 housing units sold, with a total sales value of PAB 446.10 million, down 34.38% and 29.03% year-on-year, respectively, leaving activity further below the 2019 level.
The decline was closely tied to financing constraints. Convivienda noted that public and private banks became less active in mortgage approvals amid delayed government payments related to housing incentives and changes to key support programs, including the Bono Solidario (Solidarity Housing Subsidy) and the Preferential Interest Rate Law. The latter plays an important role in Panama’s mass-market housing segment, as preferential mortgage conditions support purchasing capacity in price ranges where buyer eligibility is highly sensitive to financing costs.
Changes to preferential-interest coverage also affected the structure of demand. The eligible range effectively narrowed from homes priced up to PAB 180,000 to those up to PAB 120,000, reducing the share of Convivienda sales covered by the scheme from 92% to 81%. Meanwhile, the PAB 120,001–350,000 segment increased its share to 16%, compared with 5% in 2024. Law 468 of 2025 introduced a new framework for preferential-rate mortgages, but its effect on demand will depend on implementation and renewed bank participation.
Note: Data reflect sales reported by participating member developers of Convivienda and do not represent total residential transactions in Panama.
Data Source: Convivienda.
Sales remained concentrated in the affordable and lower-middle-income segments. The largest number of transactions was recorded in the PAB 40,001–60,000 range, followed by PAB 100,001–120,000. Convivienda notes that the PAB 40,001–60,000 segment serves Panama’s working middle class, making it especially sensitive to employment conditions, household debt levels, bank rates, and credit availability.
The higher-end market remained comparatively small, accounting for 3% of sales above PAB 350,001. This segment was broadly stable and continued to benefit from demand linked to migration from countries facing political or social instability, supported by Panama’s tax and retiree-related incentives.
Looking ahead, Convivienda projects a partial rebound in 2026, with 5,530 units sold and total sales of PAB 634.75 million, implying growth of around 38% from the depressed 2025 level. However, the recovery remains conditional on clearer implementation of the Preferential Interest Rate scheme, renewed mortgage lending, and improved affordability in the price ranges where housing need is greatest.
Property Supply Trends
Housing Deliveries Remain Below Recent Peaks
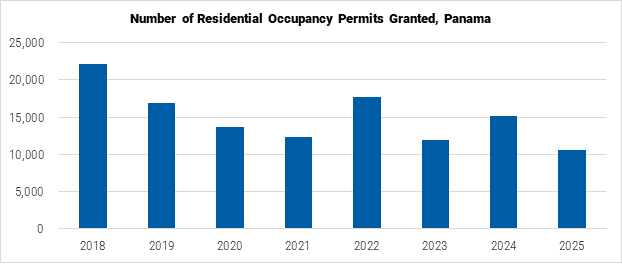
Housing supply, measured by occupancy permits issued in the municipalities tracked by Convivienda, weakened further in 2025. The top-line annual series shows 10,600 housing units delivered across the covered municipalities, down 30.29% year-on-year and still well below the recent peak of 17,729 units recorded in 2022 and the pre-pandemic level of 16,926 units recorded in 2019. Convivienda notes, that the figures should be read as a representative indicator of delivery activity in the country’s main residential construction markets, rather than a full national census.
Data Source: Convivienda.
The Metropolitan Area remained the main source of deliveries, accounting for 6,816 occupancy permits, or 64% of the 2025 total, while the main interior districts covered by the survey accounted for 3,784 units, or 36%. Within the Metropolitan Area, delivery activity fell sharply, with occupancy permits down 35.70% year-on-year. The decline was led by La Chorrera, where permits dropped by 74.74%, while Panama district also contracted by 19.82%. Arraiján was the only major metropolitan district to record growth, although the increase was modest at 3.00%, while San Miguelito remained unchanged at a very low level of activity. The report describes this as an unusually weak pattern in the historical series for occupancy permits.
Number of occupancy permits granted, by metropolitan district:
| Occupancy Permits Granted, 2025 |
YoY, % | |
| Panama District | 4,613 | -19.82% |
| La Chorrera | 906 | -74.74% |
| Arraiján | 1,236 | 3.00% |
| San Miguelito | 61 | 0.00% |
| Total Metropolitan area | 6,816 | -35.70% |
| Data Source: Convivienda. | ||
The interior market showed a headline improvement, but the increase was not broad-based. Permits in the selected interior districts rose by 11.13% year-on-year, partly due to changes in the coverage of the dataset, as Chepo and Las Tablas were included for the first time, and partly due to a large number of government-related deliveries in Colón. Excluding the Colón effect, the underlying picture remained weaker, with the report indicating that interior delivery activity would still have been in decline.
According to Convivienda, the weakness in deliveries reflects the sector’s sensitivity to policy and financing conditions. The report links part of the volatility to uncertainty around the Preferential Interest Rate Law, with housing deliveries pausing at the end of 2024, resuming after the first approval of the law in 2025, and then slowing again as further legal modifications became necessary. This highlights the importance of legal certainty and mortgage access for the delivery pipeline, particularly in the price ranges where mass-market housing is concentrated.
Forward-looking indicators point to a cautious recovery rather than a full normalization of supply. Member-developer plans suggest that future activity will remain concentrated in houses priced up to PAB 120,000, while apartment supply is expected mainly from PAB 120,001 upward. Geographically, planned activity is expected to improve across the main metropolitan districts, while in the interior it is more concentrated in San Carlos, Chame, Antón and Penonomé. Overall, the supply outlook remains closely tied to the implementation of the Preferential Interest Rate framework, mortgage availability, and developers’ ability to convert planned projects into completed units.
Rental Market: Rents and Rental Yields
Demand Sustained by Expats and Tourists
The traditional long-term rental market in Panama is relatively limited. Based on data from the 2023 Population and Housing Census, only 13.12% of residences (about 158 thousand units) in the country are rented, compared to 63.50% fully owned and 18.08% mortgaged residences.
Panama's rent price index:
Rental inflation on existing contracts in the country, as measured by change in the rentals for housing component of the national urban consumer price index (CPI), continues to hold steady close to 0%, with only marginal variations in the sub-index observed in recent months since the National Institute of Statistics and Census (INEC) began publication of a new 2024-based series last September.
At the same time, according to the Q1 2026 report from the local agency Panama Equity Real Estate, amid tightening inventory and increased immigration, asking rents have been steadily rising for over 12 months now, indicating a market entering an “early stage of a new expansion phase”. Confirming this assessment, the analysis based on housing listed on the property platform Encuentra24 shows that the average asking rent per square meter in Panama City reached USD 14.70 (up 13.5% year-on-year) and USD 9.12 for houses (up 13.2% year-on-year) in June 2026.
On a per-unit basis, research by Global Property Guide in April 2026 found the average monthly rent in Panama City at USD 1,650 for studios and 1-bedroom units, USD 1,650 for two-bedroom units, USD 2,500 for 3-bedroom units, and USD 5,500 for larger units with 4 or more bedrooms. The corresponding gross rental yields for residential properties averaged 7.57% (slightly down from 7.83% previously reported in April 2025). Nationally, the average yield level reached 6.94% (up from 6.84% in April 2025).
Data Sources: INEC, ATP.
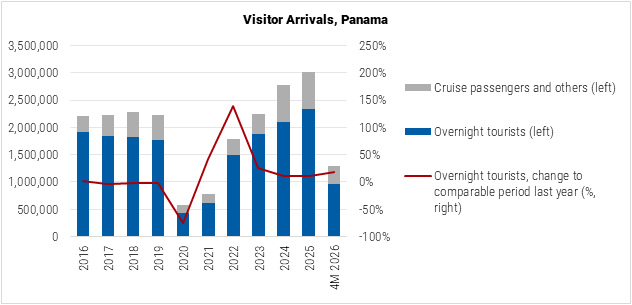
Adding to the demand in the housing market are consistently growing tourist inflows. In the first four months of 2026, the Panama Tourism Authority (ATP) reported a total of 1.29 million visitor arrivals (+16.4% year-on-year), including nearly 955 thousand overnight tourists (+18.2% year-on-year). Tourism expenditures during the same period reached USD 2.6 billion, showing a 15.0% annual increase. Based on arrivals at the Tocumen International Airport, the majority of international visitors came to Panama from South America (36.9%), North America (29.7%), and Europe (15.0%). Key markets of origin traditionally were the USA (over 199 thousand visitors) and Colombia (over 127 thousand visitors).
The full recovery of Panama’s tourism sector from the impact of the global pandemic and its return to a strong growth trajectory increased the relevance of vacation properties and short-term holiday rentals to the country’s real estate market. Some local experts, however, question the short-term rental (STR) ownership model and potential returns due to current regulations (which, for example, prohibit, rentals shorter than 45 days in Panama City for properties not registered as hotels or similar tourism accommodations) and average hotel occupancy levels. “Until Panama passes legislation that formalizes Airbnb legality, any short-term rental play comes with elevated risk, unless the property already has a license,” Kent Davis of Panama Equity Real Estate commented last year.
The July 2026 data from AirDNA shows the largest number of active short-term rental listings and the highest average occupancy in the province of Panama. Among the more active local submarkets (with 100 or more active listings), the highest average daily rates over the last twelve months were observed in the provinces of Colon, Cocle, and Los Santos.
Key short-term rental indicators across selected submarkets as of July 2026:
| Submarket (province) | Total Active Listings | Average Daily Rent (USD), over the last 12 months |
Average Occupancy, over the last 12 months (%) |
| Panama | 3,625 | USD 90.5 | 68% |
| Panama Oeste | 1,701 | USD 130.8 | 43% |
| Chiriqui | 1,179 | USD 73.5 | 47% |
| Cocle | 866 | USD 160.4 | 38% |
| Bocas del Toro | 793 | USD 131.5 | 51% |
| Los Santos | 446 | USD 157.1 | 43% |
| Colon | 310 | USD 258.8 | 37% |
| Veraguas | 278 | USD 87.0 | 45% |
| Note: Submarkets with at least 100 active listings selected. Total active listings — number of listings viewable of Airbnb and/or VRBO with at least one prior booked night. | |||
| Data Source: AirDNA. | |||
Mortgage Market and Interest Rates
Interest Rates Elevated, Implementation of New Preferential Regime Slows Lending Activity
Reflecting medium-term trends observed in the US (as the country’s economy is dollarized, with the US Dollar used as legal tender alongside local currency, the Balboa, which exists only in coins at 1:1 parity with USD), interest rates in Panama remain elevated, primarily influenced by US dollar funding costs, liquidity in the banking system, and competition among lenders.
Panama's mortgage loan interest rates:
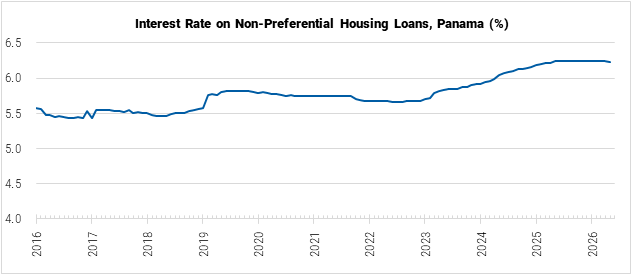
Based on data from the Superintendency of Banks of Panama (SBP), the country’s banking regulator, the interest rate on non-preferential housing loans in the national banking system has changed little over the past year, standing at 6.23% as of May 2026, compared to 6.24% a year prior.
To support buyers with lower purchasing power, Panama’s authorities enacted Law 468 of 2025, (later amended by Law 481 of 2025), which fully replaced Law 3 of 1985 from January 2026 and transformed the country’s preferential interest rate regime by establishing fixed housing subsidies covering up to 5.5 percentage points of the bank’s interest rate, based on the value of the financed property and its location. The benefit applies to new primary residences with a purchase price of up to USD 120,000 for a non-renewable term of 5-8 years, after which loans revert to full commercial rates.
Data Source: SPB.
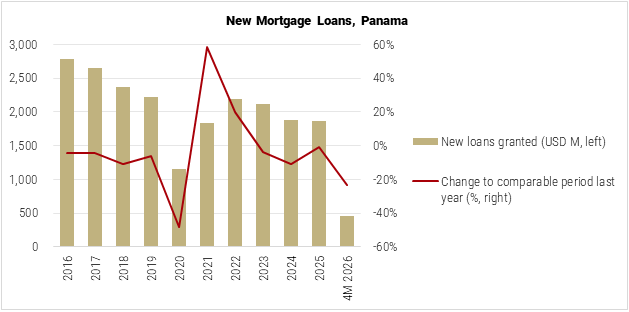
Although the passing of the new law last year was generally positively received by the business sector, it also raised concerns about some provisions that discouraged banks from participating in the subsidy scheme under new conditions. Operational delays in the rollout of the reformed regime and still-elevated market rates led to a notable slowdown in new mortgage originations, particularly in the subsidized (preferential) segment, despite Panama’s banking system remaining liquid and well-capitalized. In the first four months of 2025, the SBP reported a total of USD 460 million in new mortgages, which was 23.5% below the comparable period last year. The value of subsidized loans granted during this period, registered a 34% year-on-year decline.
“Demand for new loans to purchase homes remains weak, reflecting the sluggishness of the construction sector and an impact on the purchasing power of families who are postponing home purchase plans due to the economic situation,” La Prensa summarized in May 2025.
Despite weaker start of the year, SBP officials reportedly expect mortgage activity to improve later in 2026, once the implementation issues surrounding the revised law are fully resolved.
Data Source: SPB.
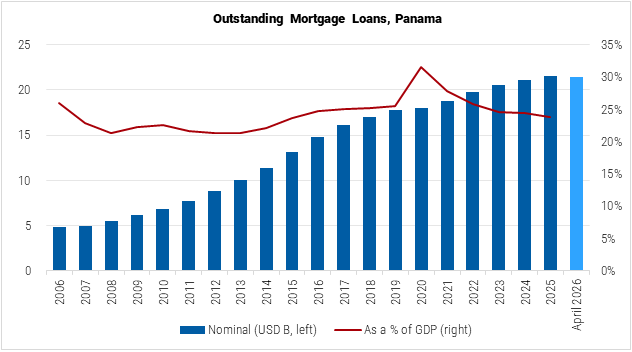
As of April 2026, the total value of outstanding mortgage credit in Panama stood at USD 21.4 billion, a 0.7% decline from the end of last year. Of that amount, 94.3% was represented by loans on owner-occupied housing, and about 5.7% by loans on commercial properties. The larger share of the stock was held by domestic and foreign private banks (75.2%), with state-owned (“official”) banks holding 24.8%. The residential mortgage portfolio under the preferential regime reached USD 9.5 billion, according to SPB figures.
The relative size of Panama’s mortgage market, measured by the ratio of outstanding loans to GDP at current prices, moderated from an estimated peak of 31.6% in 2020 to 23.9% in 2025.
Data Sources: SPB, IMF.
Economic and Social Factors
Growth in Recovery, Inflation Up From Very Low Levels
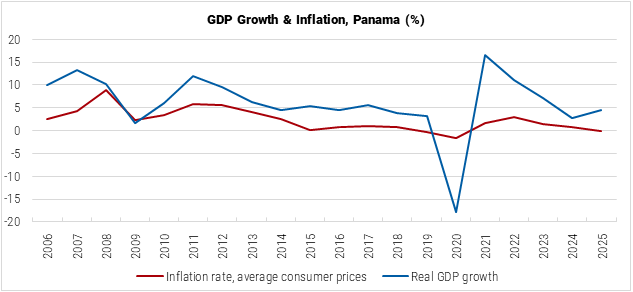
Impacted by the end of megaprojects, canal drought, and the suspension of activities at Cobre Panama, the country's largest mine, which directly and indirectly accounted for about 5% of GDP and 2% of employment, Panama’s real GDP growth had previously decelerated sharply from 7.2% in 2023 to 2.7% in 2024, according to figures from the International Monetary Fund (IMF). However, spillovers to the rest of the economy appear to have been limited and non-mining activity accelerated since, driving a recovery in growth (4.4% in 2025). The IMF expects growth to moderate slightly to 3.8% in 2026 (due to a fall in global trade resulting from the Middle East conflict) before picking up again to 4.5% in 2027 and remaining around that level over the medium term. Similarly, the World Bank projects the Panamanian economy will expand by 3.9% in 2026 and by 4.1% in 2027.
Consumer price index (CPI) inflation in the country accelerated somewhat in recent months from very low levels (0.7% in 2024 and 0.0% in 2025). In May 2026, the National Institute of Statistics and Census (INEC) reported the national urban consumer price index inflation at 2.5%, up from 2.1% in April and 0.8% in March. The annual average is projected by the IMF to reach 1.4% in 2026 and 2.0% in 2027, while the World Bank projects 1.5% and 1.6%, respectively.
Data Source: IMF.
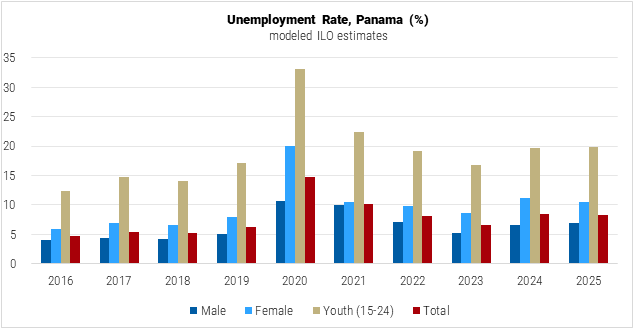
In the Panamanian labor market, a substantial portion of the labor force remains engaged in informal employment (around 53% informality, according to the World Bank). At the same time, overall unemployment (modeled ILO estimate) stood at 8.4% in 2025 and remained notably higher for the female population (10.4%) and the young population aged 15 to 24 (19.8%).
Data Source: World Bank.
In general, due to its strategic location, the Panama Canal's role in global trade, and a dollarized economy, Panama remains a key logistical and financial hub in Central America. While positive overall, the country’s development prospects are vulnerable to risks from global trade uncertainties, tighter global financing conditions, and geopolitical tensions affecting prices.
In December 2025, Fitch Ratings affirmed Panama’s ‘BB+’ standing with a stable outlook, noting its robust medium-term growth prospects centered around logistics activities, counterbalanced by weaknesses in governance and public finances, including a narrow government revenue base, high and rising government debt and interest burdens, heavy reliance on external markets for funding, and weak fiscal transparency.
Sources:
- The National Institute of Statistics and Census (INEC)
- Price Index (ES): https://www.inec.gob.pa/
- Population and Housing Censuses (ES): https://www.inec.gob.pa/
- International Passenger Movement (ES): https://www.inec.gob.pa/
- Exchange Rates (ES): https://www.inec.gob.pa/
- Superintendency of Banks of Panama (SBP)
- Financial Statistics (ES): https://www.superbancos.gob.pa/
- Interest Rates (ES): https://www.superbancos.gob.pa/
- Publications (ES): https://www.superbancos.gob.pa/
- The Ministry of Government (Mingob)
- Application for Permanent Resident Permit as a Retiree and Pensioner (ES): https://www.panamadigital.gob.pa/
- Permanent Resident as a Qualified Investor (ES): https://www.propanama.gob.pa/
- Panama Tourism Authority (ATP)
- Panama Tourism Performance Analysis: Report from January to April 2026 (ES): https://www.atp.gob.pa/
- Gaceta Oficial
- Law 481 of 2025 (ES): https://www.gacetaoficial.gob.pa/
- Law 468 of 2025 (ES): https://www.gacetaoficial.gob.pa/
- International Monetary Fund (IMF)
- Country Overview: Panama: https://www.imf.org/
- 2025 Article IV Staff Report: https://www.imf.org/
- World Bank
- Panama MPO, April 2026: https://thedocs.worldbank.org/
- World Development Indicators: https://datacatalog.worldbank.org/
- National Council of Housing Developers (Convivienda)
- Results and Projections Report, 2025-2026 (ES): https://convivienda.com/
- Results and Projections Report, 2025-2026, Speech by Executive Director (ES): https://convivienda.com/
- Encuentra24
- Property Pricing Trend in Panama: https://www.encuentra24.com/
- AirDNA
- Short-Term Rental Markets: Panama: https://app.airdna.co/
- Center for Financial Research, Torcuato Di Tella University
- Real Estate Survey of Latin America (RIAL) (ES): https://www.utdt.edu/
- Panama Equity Real Estate
- Panama Real Estate Market Report Q1 2026: Our Outlook for Real Estate: https://www.panamaequity.com/
- Panama Real Estate Market Report Q1 2025: A Market in Transition: https://www.panamaequity.com/
- KPMG Panama
- New Preferential Interest Rate Regime for Mortgage Loans (ES): https://kpmg.com/
- Fitch Ratings
- Fitch Affirms Panama at 'BB+'; Outlook Stable: https://www.fitchratings.com/
- La Prensa
- 2% Tax Divides the Housing Sector (ES): https://www.prensa.com/
- Approval of New Preferential Mortgage Loans Falls by 34% (ES): https://www.prensa.com/
- Newsroom Panama
- 34% Drop in Panamanian Banks Mortgage Loan Portfolios in 2026: https://newsroompanama.com/