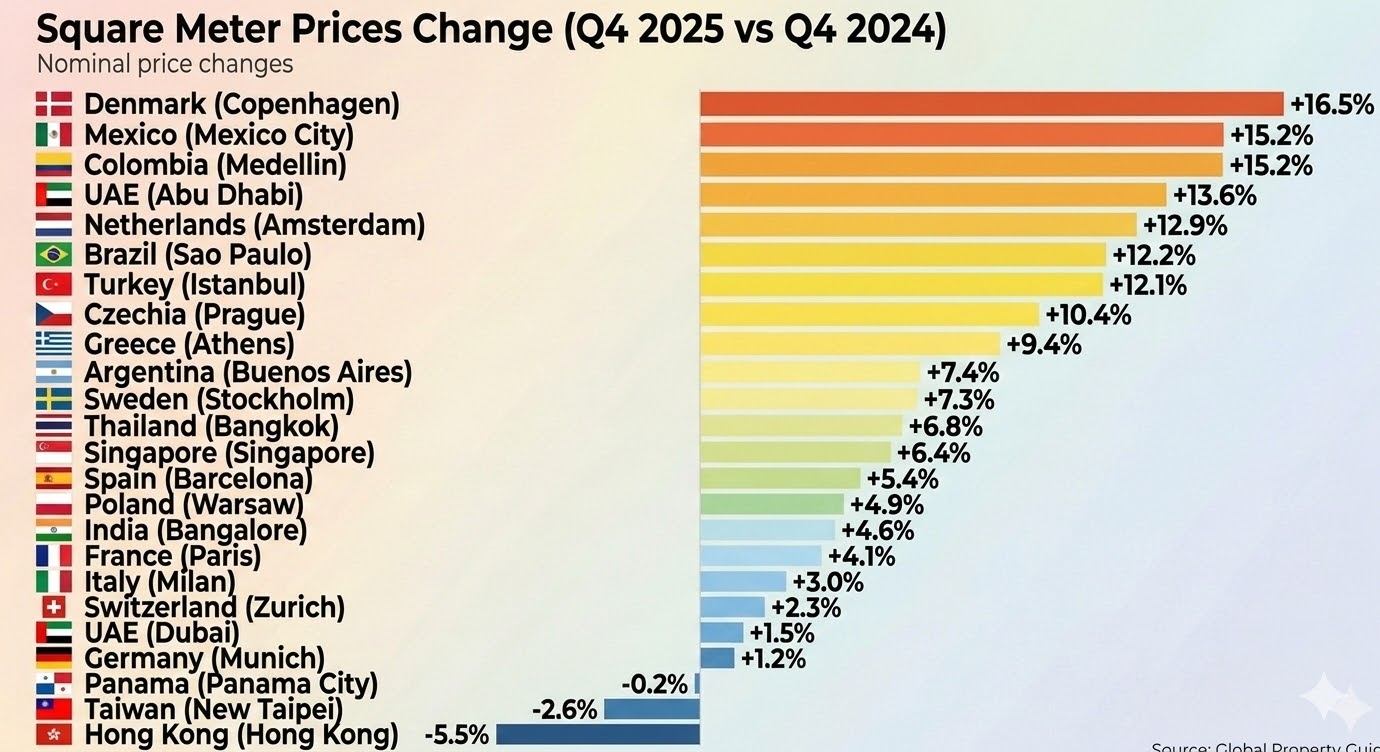
The Q4 2025 real estate landscape shows an extraordinary surge in emerging markets and high-yield "lifestyle" destinations.
While traditional hubs in North America and parts of Western Europe are cooling, cities in South Africa, Turkey, Brazil, and Southeast Asia are seeing historic levels of appreciation.
This report provides a granular year-over-year (YoY) comparison of square meter prices to identify the world's fastest-growing and correcting markets.
1. Europe
The European market is currently defined by high growth in the East and North. Moldova and Bulgaria lead the appreciation rankings, while Czechia and Norway also show strong double-digit gains. Conversely, parts of Denmark and Finland are experiencing significant price corrections. Some cities in France and Poland are also cooling.
| Country | City / Area | Price 1Y Ago | Last Price | Timeframe | YoY % |
|---|---|---|---|---|---|
| Bulgaria 🇧🇬 | Sofia | €1,840 | €2,310 | Q3 25 vs Q3 24 | +25.5% |
| Czechia 🇨🇿 | Ostrava | €2,022 | €2,518 | Q4 25 vs Q4 24 | +24.5% |
| Spain 🇪🇸 | Santa Cruz (Tenerife) | €2,147 | €2,642 | Q4 25 vs Q4 24 | +23.1% |
| Georgia 🇬🇪 | Tbilisi* | €1,190 | €1,433 | Q4 25 vs Q4 24 | +20.4% |
| Norway 🇳🇴 | Bergen | €4,691 | €5,641 | Q4 25 vs Q4 24 | +20.3% |
| Greece 🇬🇷 | Kavala | €1,810 | €2,174 | Q4 25 vs Q4 24 | +20.1% |
| Spain 🇪🇸 | Malaga | €3,217 | €3,802 | Q4 25 vs Q4 24 | +18.2% |
| Spain 🇪🇸 | Alicante | €2,329 | €2,751 | Q4 25 vs Q4 24 | +18.1% |
| Spain 🇪🇸 | Valencia | €2,082 | €2,449 | Q4 25 vs Q4 24 | +17.6% |
| Slovakia 🇸🇰 | Kosice | €2,222 | €2,608 | Q4 25 vs Q4 24 | +17.4% |
| Denmark 🇩🇰 | Copenhagen | €7,050 | €8,212 | Q3 25 vs Q3 24 | +16.5% |
| Czechia 🇨🇿 | Brno | €4,405 | €5,111 | Q4 25 vs Q4 24 | +16.0% |
| Greece 🇬🇷 | Chania | €2,545 | €2,936 | Q4 25 vs Q4 24 | +15.4% |
| Andorra 🇦🇩 | Andorra la Vella | €4,866 | €5,609 | Q4 25 vs Q4 24 | +15.3% |
| Romania 🇷🇴 | Bucharest | €1,662 | €1,910 | Q3 25 vs Q3 24 | +14.9% |
| Norway 🇳🇴 | Oslo | €8,022 | €9,191 | Q4 25 vs Q4 24 | +14.6% |
| Greece 🇬🇷 | Heraklion | €1,622 | €1,846 | Q4 25 vs Q4 24 | +13.8% |
| Romania 🇷🇴 | Cluj-Napoca | €2,780 | €3,150 | Q3 25 vs Q3 24 | +13.3% |
| Slovakia 🇸🇰 | Nitra | €1,404 | €1,589 | Q4 25 vs Q4 24 | +13.2% |
| Lithuania 🇱🇹 | Kaunas | €1,812 | €2,047 | Q4 25 vs Q4 24 | +13.0% |
| Netherlands 🇳🇱 | Amsterdam | €8,442 | €9,534 | Q4 25 vs Q4 24 | +12.9% |
| Slovakia 🇸🇰 | Bratislava | €3,316 | €3,731 | Q4 25 vs Q4 24 | +12.5% |
| Spain 🇪🇸 | Madrid | €5,200 | €5,825 | Q4 25 vs Q4 24 | +12.0% |
| Slovakia 🇸🇰 | Zilina | €1,949 | €2,180 | Q4 25 vs Q4 24 | +11.9% |
| Poland 🇵🇱 | Lodz | €1,893 | €2,113 | Q3 25 vs Q3 24 | +11.6% |
| Portugal 🇵🇹 | Funchal | €3,510 | €3,877 | Q4 25 vs Q4 24 | +10.5% |
| Czechia 🇨🇿 | Prague | €5,531 | €6,106 | Q4 25 vs Q4 24 | +10.4% |
| Lithuania 🇱🇹 | Vilnius | €2,632 | €2,900 | Q4 25 vs Q4 24 | +10.2% |
| Cyprus 🇨🇾 | Limassol | €4,575 | €5,031 | Q4 25 vs Q4 24 | +10.0% |
| Czechia 🇨🇿 | Olomouc | €3,032 | €3,327 | Q4 25 vs Q4 24 | +9.7% |
| Croatia 🇭🇷 | Zadar | €3,556 | €3,901 | Q4 25 vs Q4 24 | +9.7% |
| Greece 🇬🇷 | Athens | €2,250 | €2,462 | Q4 25 vs Q4 24 | +9.4% |
| Portugal 🇵🇹 | Coimbra | €2,053 | €2,244 | Q4 25 vs Q4 24 | +9.3% |
| Spain 🇪🇸 | Palma de Mallorca | €5,065 | €5,533 | Q4 25 vs Q4 24 | +9.2% |
| Ireland 🇮🇪 | Dublin | €7,534 | €8,230 | Q4 25 vs Q4 24 | +9.2% |
| Portugal 🇵🇹 | Braga | €1,954 | €2,133 | Q4 25 vs Q4 24 | +9.2% |
| Germany 🇩🇪 | Cologne | €4,735 | €5,164 | Q4 25 vs Q4 24 | +9.1% |
| Spain 🇪🇸 | Seville | €2,278 | €2,484 | Q4 25 vs Q4 24 | +9.0% |
| Norway 🇳🇴 | Trondheim | €4,521 | €4,922 | Q4 25 vs Q4 24 | +8.9% |
| Slovakia 🇸🇰 | Banska Bystrica | €1,604 | €1,744 | Q4 25 vs Q4 24 | +8.7% |
| Spain 🇪🇸 | Murcia | €1,610 | €1,750 | Q4 25 vs Q4 24 | +8.7% |
| Portugal 🇵🇹 | Aveiro | €2,520 | €2,736 | Q4 25 vs Q4 24 | +8.6% |
| Italy 🇮🇹 | Florence | €4,336 | €4,700 | Q4 25 vs Q4 24 | +8.4% |
| Croatia 🇭🇷 | Zagreb* | €3,398 | €3,674 | Q4 25 vs Q4 24 | +8.1% |
| Poland 🇵🇱 | Lublin | €2,291 | €2,468 | Q3 25 vs Q3 24 | +7.7% |
| Greece 🇬🇷 | Thessaloniki | €2,452 | €2,634 | Q4 25 vs Q4 24 | +7.4% |
| Latvia 🇱🇻 | Riga | €2,400 | €2,578 | Q4 25 vs Q4 24 | +7.4% |
| Portugal 🇵🇹 | Faro | €3,168 | €3,402 | Q4 25 vs Q4 24 | +7.4% |
| Sweden 🇸🇪 | Stockholm | €7,604 | €8,157 | Q4 25 vs Q4 24 | +7.3% |
| Italy 🇮🇹 | Rome | €3,428 | €3,674 | Q4 25 vs Q4 24 | +7.2% |
| Czechia 🇨🇿 | Plzen | €3,310 | €3,545 | Q4 25 vs Q4 24 | +7.1% |
| Germany 🇩🇪 | Bremen | €2,621 | €2,807 | Q4 25 vs Q4 24 | +7.1% |
| Serbia 🇷🇸 | Novi Sad | €2,549 | €2,729 | Q4 25 vs Q4 24 | +7.1% |
| Austria 🇦🇹 | Graz | €4,470 | €4,749 | Q4 25 vs Q4 24 | +6.2% |
| Denmark 🇩🇰 | Odense | €2,544 | €2,699 | Q3 25 vs Q3 24 | +6.1% |
| Germany 🇩🇪 | Hamburg | €6,030 | €6,360 | Q4 25 vs Q4 24 | +5.5% |
| Spain 🇪🇸 | Barcelona | €4,080 | €4,302 | Q4 25 vs Q4 24 | +5.4% |
| Portugal 🇵🇹 | Lisbon | €5,686 | €5,995 | Q4 25 vs Q4 24 | +5.4% |
| Portugal 🇵🇹 | Porto | €3,694 | €3,879 | Q4 25 vs Q4 24 | +5.0% |
| Poland 🇵🇱 | Warsaw | €3,696 | €3,877 | Q3 25 vs Q3 24 | +4.9% |
| Germany 🇩🇪 | Leipzig | €3,073 | €3,221 | Q4 25 vs Q4 24 | +4.8% |
| Switzerland 🇨🇭 | Luzern | €11,390 | €11,938 | Q4 25 vs Q4 24 | +4.8% |
| Spain 🇪🇸 | Cordoba | €1,504 | €1,576 | Q4 25 vs Q4 24 | +4.8% |
| Italy 🇮🇹 | Naples | €2,892 | €3,021 | Q4 25 vs Q4 24 | +4.5% |
| Austria 🇦🇹 | Salzburg | €9,099 | €9,483 | Q4 25 vs Q4 24 | +4.2% |
| Belgium 🇧🇪 | Liege | €2,200 | €2,290 | Q2 25 vs Q2 24 | +4.1% |
| Belgium 🇧🇪 | Oostend | €3,059 | €3,184 | Q2 25 vs Q2 24 | +4.1% |
| France 🇫🇷 | Paris | €9,299 | €9,678 | Q4 25 vs Q4 24 | +4.1% |
| Italy 🇮🇹 | Genoa | €1,676 | €1,744 | Q4 25 vs Q4 24 | +4.1% |
| Sweden 🇸🇪 | Malmö | €3,203 | €3,330 | Q4 25 vs Q4 24 | +4.0% |
| Portugal 🇵🇹 | Algarve | €3,715 | €3,853 | Q4 25 vs Q4 24 | +3.7% |
| Ukraine 🇺🇦 | Kyiv | €1,890 | €1,960 | Q4 25 vs Q4 24 | +3.7% |
| Italy 🇮🇹 | Turin | €2,045 | €2,117 | Q4 25 vs Q4 24 | +3.5% |
| Italy 🇮🇹 | Catania | €1,270 | €1,312 | Q4 25 vs Q4 24 | +3.3% |
| Germany 🇩🇪 | Stuttgart | €4,746 | €4,895 | Q4 25 vs Q4 24 | +3.1% |
| France 🇫🇷 | Toulouse | €3,417 | €3,523 | Q4 25 vs Q4 24 | +3.1% |
| Italy 🇮🇹 | Milan | €5,420 | €5,582 | Q4 25 vs Q4 24 | +3.0% |
| France 🇫🇷 | Strasbourg | €3,666 | €3,772 | Q4 25 vs Q4 24 | +2.9% |
| Sweden 🇸🇪 | Uppsala | €3,575 | €3,675 | Q4 25 vs Q4 24 | +2.8% |
| Belgium 🇧🇪 | Antwerp | €2,788 | €2,865 | Q2 25 vs Q2 24 | +2.8% |
| Belgium 🇧🇪 | Mechelen | €2,799 | €2,876 | Q2 25 vs Q2 24 | +2.8% |
| France 🇫🇷 | Lyon | €4,577 | €4,698 | Q4 25 vs Q4 24 | +2.6% |
| Italy 🇮🇹 | Palermo | €1,491 | €1,528 | Q4 25 vs Q4 24 | +2.5% |
| France 🇫🇷 | Nantes | €3,349 | €3,432 | Q4 25 vs Q4 24 | +2.5% |
| Cyprus 🇨🇾 | Nicosia | €2,265 | €2,322 | Q4 25 vs Q4 24 | +2.5% |
| Belgium 🇧🇪 | Leuven | €3,444 | €3,527 | Q2 25 vs Q2 24 | +2.4% |
| Austria 🇦🇹 | Vienna | €7,670 | €7,854 | Q4 25 vs Q4 24 | +2.4% |
| Estonia 🇪🇪 | Tallinn | €3,011 | €3,081 | Q4 25 vs Q4 24 | +2.3% |
| Switzerland 🇨🇭 | Zurich | €17,695 | €18,104 | Q4 25 vs Q4 24 | +2.3% |
| Poland 🇵🇱 | Gdansk | €3,053 | €3,121 | Q3 25 vs Q3 24 | +2.2% |
| Germany 🇩🇪 | Frankfurt | €6,315 | €6,451 | Q4 25 vs Q4 24 | +2.2% |
| France 🇫🇷 | Montpellier | €3,423 | €3,480 | Q4 25 vs Q4 24 | +1.7% |
| France 🇫🇷 | Nice | €5,149 | €5,234 | Q4 25 vs Q4 24 | +1.7% |
| Germany 🇩🇪 | Berlin | €5,299 | €5,379 | Q4 25 vs Q4 24 | +1.5% |
| France 🇫🇷 | Bordeaux | €4,421 | €4,483 | Q4 25 vs Q4 24 | +1.4% |
| Germany 🇩🇪 | Munich | €9,073 | €9,182 | Q4 25 vs Q4 24 | +1.2% |
| Belgium 🇧🇪 | Brussels | €3,481 | €3,522 | Q2 25 vs Q2 24 | +1.2% |
| Sweden 🇸🇪 | Gothenburg | €4,368 | €4,413 | Q4 25 vs Q4 24 | +1.0% |
| Finland 🇫🇮 | Tampere | €2,967 | €2,997 | Q3 25 vs Q3 24 | +1.0% |
| Switzerland 🇨🇭 | Geneva | €16,490 | €16,639 | Q4 25 vs Q4 24 | +0.9% |
| Serbia 🇷🇸 | Belgrade | €3,319 | €3,341 | Q4 25 vs Q4 24 | +0.7% |
| Denmark 🇩🇰 | Esbjerg | €1,810 | €1,821 | Q3 25 vs Q3 24 | +0.6% |
| Switzerland 🇨🇭 | Fribourg | €7,884 | €7,903 | Q4 25 vs Q4 24 | +0.2% |
| Switzerland 🇨🇭 | Aargau | €7,870 | €7,873 | Q4 25 vs Q4 24 | +0.0% |
| Montenegro 🇲🇪 | Podgorica* | €1,938 | €1,938 | Q4 25 vs Q4 24 | +0.0% |
| Switzerland 🇨🇭 | Vaud | €10,883 | €10,836 | Q4 25 vs Q4 24 | -0.4% |
| Belgium 🇧🇪 | Brugge | €4,744 | €4,722 | Q2 25 vs Q2 24 | -0.5% |
| Switzerland 🇨🇭 | Bern | €9,899 | €9,846 | Q4 25 vs Q4 24 | -0.5% |
| Poland 🇵🇱 | Poznan | €2,837 | €2,819 | Q3 25 vs Q3 24 | -0.6% |
| Luxembourg 🇱🇺 | Centre | €11,184 | €11,079 | Q4 25 vs Q4 24 | -0.9% |
| Belgium 🇧🇪 | Kortrijk | €2,523 | €2,486 | Q2 25 vs Q2 24 | -1.5% |
| Switzerland 🇨🇭 | Ticino | €8,760 | €8,625 | Q4 25 vs Q4 24 | -1.5% |
| Finland 🇫🇮 | Helsinki | €4,908 | €4,821 | Q3 25 vs Q3 24 | -1.8% |
| France 🇫🇷 | Marseille | €3,645 | €3,545 | Q4 25 vs Q4 24 | -2.7% |
| Switzerland 🇨🇭 | Valais | €7,250 | €6,989 | Q4 25 vs Q4 24 | -3.6% |
| Finland 🇫🇮 | Oulu | €2,143 | €2,041 | Q3 25 vs Q3 24 | -4.8% |
| Estonia 🇪🇪 | Tartu | €2,424 | €2,270 | Q4 25 vs Q4 24 | -6.4% |
| Finland 🇫🇮 | Turku | €2,901 | €2,704 | Q3 25 vs Q3 24 | -6.8% |
| Poland 🇵🇱 | Wroclaw | €3,526 | €3,214 | Q3 25 vs Q3 24 | -8.8% |
| Poland 🇵🇱 | Krakow | €3,842 | €3,476 | Q3 25 vs Q3 24 | -9.5% |
| Cyprus 🇨🇾 | Paphos | €4,550 | €3,940 | Q4 25 vs Q4 24 | -13.4% |
| Denmark 🇩🇰 | Aarhus | €4,878 | €3,982 | Q3 25 vs Q3 24 | -18.4% |
| Denmark 🇩🇰 | Aalborg | €2,715 | €2,148 | Q3 25 vs Q3 24 | -20.9% |
*New build or luxury apartments/residential buildings. Prices are in EUR.
2. Asia-Pacific
The Asia-Pacific region is currently seeing significant domestic surges in Pakistan, Thailand, and Vietnam, while the ultra-luxury markets of Hong Kong and Macau continue to experience downward pricing pressure.
| Country | City / Area | Price 1Y Ago | Last Price | Timeframe | YoY % |
|---|---|---|---|---|---|
| Pakistan 🇵🇰 | Karachi | $726 | $997 | Q4 25 vs Q4 24 | +37.3% |
| Thailand 🇹🇭 | Chiang Mai | $1,716 | $2,354 | Q4 25 vs Q4 24 | +37.2% |
| Thailand 🇹🇭 | Phuket | $3,405 | $4,232 | Q4 25 vs Q4 24 | +24.3% |
| Vietnam 🇻🇳 | Ha Noi | $1,909 | $2,340 | Q4 25 vs Q4 24 | +22.6% |
| Thailand 🇹🇭 | Pattaya | $2,531 | $2,924 | Q4 25 vs Q4 24 | +15.5% |
| India 🇮🇳 | Chennai | $1,046 | $1,156 | Q3 25 vs Q3 24 | +10.5% |
| India 🇮🇳 | Ahmedabad | $856 | $940 | Q3 25 vs Q3 24 | +9.8% |
| Thailand 🇹🇭 | Bangkok* | $5,081 | $5,427 | Q4 25 vs Q4 24 | +6.8% |
| Singapore 🇸🇬 | Singapore | $18,135 | $19,300 | Q4 25 vs Q4 24 | +6.4% |
| China 🇨🇳 | Beijing | $4,398 | $4,671 | Q4 25 vs Q4 24 | +6.2% |
| India 🇮🇳 | Bangalore | $1,239 | $1,296 | Q3 25 vs Q3 24 | +4.6% |
| Kazakhstan 🇰🇿 | Almaty* | $1,123 | $1,174 | Q4 25 vs Q4 24 | +4.5% |
| India 🇮🇳 | Surat | $759 | $788 | Q3 25 vs Q3 24 | +3.8% |
| Malaysia 🇲🇾 | Kuala Lumpur* | $2,393 | $2,484 | Q3 25 vs Q3 24 | +3.8% |
| Pakistan 🇵🇰 | Islamabad | $1,155 | $1,197 | Q4 25 vs Q4 24 | +3.6% |
| Cambodia 🇰🇭 | Phnom Penh* | $2,714 | $2,810 | Q3 25 vs Q3 24 | +3.5% |
| China 🇨🇳 | Chongqing | $952 | $965 | Q4 25 vs Q4 24 | +1.4% |
| India 🇮🇳 | Pune | $1,200 | $1,210 | Q3 25 vs Q3 24 | +0.8% |
| Japan 🇯🇵 | Osaka | $2,959 | $2,982 | Q4 25 vs Q4 24 | +0.8% |
| China 🇨🇳 | Shanghai | $5,682 | $5,686 | Q4 25 vs Q4 24 | +0.1% |
| Japan 🇯🇵 | Tokyo | $5,403 | $5,377 | Q4 25 vs Q4 24 | -0.5% |
| Indonesia 🇮🇩 | Jakarta | $2,137 | $2,121 | Q4 25 vs Q4 24 | -0.7% |
| India 🇮🇳 | Kolkata | $1,013 | $1,004 | Q3 25 vs Q3 24 | -0.9% |
| India 🇮🇳 | Mumbai | $3,388 | $3,315 | Q3 25 vs Q3 24 | -2.2% |
| Taiwan 🇹🇼 | New Taipei | $4,663 | $4,540 | Q3 25 vs Q3 24 | -2.6% |
| Taiwan 🇹🇼 | Taipei City | $8,314 | $8,020 | Q3 25 vs Q3 24 | -3.5% |
| South Korea 🇰🇷 | Seoul | $11,121 | $10,716 | Q3 25 vs Q3 24 | -3.6% |
| India 🇮🇳 | Hyderabad | $1,015 | $972 | Q3 25 vs Q3 24 | -4.2% |
| Taiwan 🇹🇼 | Tainan City | $2,519 | $2,410 | Q3 25 vs Q3 24 | -4.3% |
| Philippines 🇵🇭 | Manila* | $3,608 | $3,449 | Q3 25 vs Q3 24 | -4.4% |
| India 🇮🇳 | Delhi | $1,267 | $1,209 | Q3 25 vs Q3 24 | -4.6% |
| Kazakhstan 🇰🇿 | Pavlodar* | $732 | $697 | Q4 25 vs Q4 24 | -4.8% |
| Hong Kong 🇭🇰 | Hong Kong | $23,579 | $22,291 | Q4 25 vs Q4 24 | -5.5% |
| Taiwan 🇹🇼 | Taoyuan | $3,058 | $2,880 | Q3 25 vs Q3 24 | -5.8% |
| Pakistan 🇵🇰 | Lahore | $852 | $791 | Q4 25 vs Q4 24 | -7.2% |
| Kazakhstan 🇰🇿 | Astana* | $1,128 | $997 | Q4 25 vs Q4 24 | -11.6% |
| Macau 🇲🇴 | ALL | $10,799 | $9,253 | Q3 25 vs Q3 24 | -14.3% |
*New build or luxury apartments/residential buildings. Prices are in USD.
3. Middle East & Africa
The story of the Middle East and Africa is defined by hyper-growth in South Africa and the high-inflation resilience of the Turkish property market. UAE also continues to show strong capital appreciation in Abu Dhabi.
| Country | City / Area | Price 1Y Ago | Last Price | Timeframe | YoY % |
|---|---|---|---|---|---|
| Turkey 🇹🇷 | Kayseri | $474 | $595 | Q4 25 vs Q4 24 | +25.5% |
| Turkey 🇹🇷 | Adana | $691 | $840 | Q4 25 vs Q4 24 | +21.6% |
| Turkey 🇹🇷 | Ankara | $788 | $946 | Q4 25 vs Q4 24 | +20.1% |
| Turkey 🇹🇷 | Bursa | $707 | $834 | Q4 25 vs Q4 24 | +18.0% |
| South Africa 🇿🇦 | Pretoria | $540 | $637 | Q4 25 vs Q4 24 | +18.0% |
| Tunisia 🇹🇳 | Tunis | $1,057 | $1,226 | Q4 25 vs Q4 24 | +16.0% |
| Turkey 🇹🇷 | Konya | $641 | $741 | Q4 25 vs Q4 24 | +15.6% |
| South Africa 🇿🇦 | Durban | $654 | $755 | Q4 25 vs Q4 24 | +15.4% |
| UAE 🇦🇪 | Abu Dhabi | $3,458 | $3,928 | Q4 25 vs Q4 24 | +13.6% |
| Turkey 🇹🇷 | Istanbul | $1,516 | $1,700 | Q4 25 vs Q4 24 | +12.1% |
| Turkey 🇹🇷 | Izmir | $1,027 | $1,137 | Q4 25 vs Q4 24 | +10.7% |
| Turkey 🇹🇷 | Antalya | $1,056 | $1,155 | Q4 25 vs Q4 24 | +9.4% |
| South Africa 🇿🇦 | KZN South Coast | $764 | $821 | Q4 25 vs Q4 24 | +7.5% |
| Mauritius 🇲🇺 | Port Louis | $1,144 | $1,200 | Q4 25 vs Q4 24 | +4.9% |
| Qatar 🇶🇦 | Doha | $2,819 | $2,880 | Q2 25 vs Q2 24 | +2.2% |
| UAE 🇦🇪 | Dubai | $5,629 | $5,711 | Q4 25 vs Q4 24 | +1.5% |
| Morocco 🇲🇦 | Casablanca | $1,385 | $1,361 | Q4 25 vs Q4 24 | -1.7% |
Prices are in USD.
4. Latin America / Caribbean
This region holds the highest density of double-digit performers globally. Brazil continues to surge across almost every tracked city, while Chile and Mexico also show exceptional strength.
| Country | City / Area | Price 1Y Ago | Last Price | Timeframe | YoY % |
|---|---|---|---|---|---|
| Chile 🇨🇱 | Antofagasta | $2,219 | $2,667 | Q4 25 vs Q4 24 | +20.2% |
| Brazil 🇧🇷 | Salvador | $1,180 | $1,402 | Q4 25 vs Q4 24 | +18.8% |
| Chile 🇨🇱 | Santiago | $2,902 | $3,350 | Q3 25 vs Q3 24 | +15.4% |
| Mexico 🇲🇽 | Mexico City | $2,462 | $2,836 | Q4 25 vs Q4 24 | +15.2% |
| Colombia 🇨🇴 | Medellin | $1,597 | $1,839 | Q4 25 vs Q4 24 | +15.2% |
| Brazil 🇧🇷 | Curitiba | $1,837 | $2,112 | Q4 25 vs Q4 24 | +15.0% |
| Brazil 🇧🇷 | Florianopolis | $2,042 | $2,337 | Q4 25 vs Q4 24 | +14.4% |
| Dominican Republic 🇩🇴 | Punta Cana | $2,216 | $2,522 | Q4 25 vs Q4 24 | +13.8% |
| Brazil 🇧🇷 | Fortaleza | $1,379 | $1,566 | Q4 25 vs Q4 24 | +13.6% |
| Chile 🇨🇱 | Santiago | $2,902 | $3,350 | Q3 25 vs Q3 24 | +13.3% |
| Brazil 🇧🇷 | Brasilia | $1,626 | $1,834 | Q4 25 vs Q4 24 | +12.8% |
| Brazil 🇧🇷 | Rio de Janeiro | $1,782 | $2,006 | Q4 25 vs Q4 24 | +12.6% |
| Brazil 🇧🇷 | Sao Paulo | $1,961 | $2,200 | Q4 25 vs Q4 24 | +12.2% |
| Costa Rica 🇨🇷 | Curridabat | $1,935 | $2,170 | Q4 25 vs Q4 24 | +12.1% |
| Brazil 🇧🇷 | Recife | $1,389 | $1,548 | Q4 25 vs Q4 24 | +11.4% |
| Costa Rica 🇨🇷 | San Jose | $2,391 | $2,658 | Q4 25 vs Q4 24 | +11.2% |
| Mexico 🇲🇽 | Guadalajara | $3,214 | $3,533 | Q4 25 vs Q4 24 | +9.9% |
| Brazil 🇧🇷 | Manaus | $1,231 | $1,350 | Q4 25 vs Q4 24 | +9.7% |
| Chile 🇨🇱 | Vina del Mar | $2,384 | $2,603 | Q4 25 vs Q4 24 | +9.2% |
| Argentina 🇦🇷 | Buenos Aires | $2,028 | $2,178 | Q4 25 vs Q4 24 | +7.4% |
| Uruguay 🇺🇾 | Montevideo | $2,671 | $2,865 | Q3 25 vs Q3 24 | +7.3% |
| Mexico 🇲🇽 | Monterrey | $3,585 | $3,823 | Q4 25 vs Q4 24 | +6.6% |
| Costa Rica 🇨🇷 | Santa Ana | $1,894 | $2,015 | Q4 25 vs Q4 24 | +6.4% |
| Chile 🇨🇱 | Valparaiso | $2,647 | $2,739 | Q4 25 vs Q4 24 | +3.5% |
| Peru 🇵🇪 | Lima | $1,839 | $1,900 | Q3 25 vs Q3 24 | +3.3% |
| Costa Rica 🇨🇷 | Escazu | $2,045 | $2,101 | Q4 25 vs Q4 24 | +2.7% |
| Puerto Rico 🇵🇷 | San Juan | $5,562 | $5,648 | Q4 25 vs Q4 24 | +1.5% |
| Dominican Republic 🇩🇴 | Santo Domingo | $2,269 | $2,281 | Q4 25 vs Q4 24 | +0.5% |
| Panama 🇵🇦 | Panama City | $2,608 | $2,602 | Q4 25 vs Q4 24 | -0.2% |
| Colombia 🇨🇴 | Bogota | $1,704 | $1,670 | Q4 25 vs Q4 24 | -2.0% |
| Bahamas 🇧🇸 | Bahamas | $5,493 | $5,211 | Q4 25 vs Q4 24 | -5.1% |
Prices are in USD.
Data Sources: Global Property Guide (Q4 2025); proprietary data from real estate listing sites, agencies, governments, banks, and national statistics offices.