The United Kingdom Residential Property Market Analysis 2026
The UK housing market remained subdued in mid-2026, with modest price growth and tentative signs of stabilization in demand offset by elevated borrowing costs, weak housebuilding activity, and persistent rental supply constraints.
This extended overview from the Global Property Guide covers key aspects of the UK housing market and takes a closer look at its most recent developments and long-term trends.
Table of Contents
- Property Prices and Price Index
- Historic Perspective
- Property Demand Trends
- Property Supply Trends
- Rental Market: Rents and Rental Yields
- Mortgage Market and Interest Rates
- Economic and Social Factors
Property Prices and Price Index
UK house-price growth remained modest in mid-2026, as elevated mortgage rates, higher energy costs, and weaker confidence constrained demand. Nevertheless, limited housing supply and continued earnings growth helped prevent a broader decline in values. According to Nationwide Building Society, the average non-seasonally adjusted house price stood at GBP 277,484 (USD 372,661) in June 2026, up by 2.2% year-on-year. Annual growth accelerated from 1.7% in May, although prices remained broadly unchanged month-on-month on a seasonally adjusted basis.
Robert Gardner, Nationwide’s Chief Economist, attributed the recent softening to geopolitical uncertainty and the associated rise in energy prices and market interest rates. However, he noted that the subsequent easing in oil prices and mortgage-market rates could gradually improve affordability and support a recovery in activity, provided domestic political uncertainty does not further weaken sentiment.
United Kingdom's house price annual change:
At the regional level, all 13 submarkets recorded annual price growth in Q2 2026, although the rate remained below 4% everywhere except Northern Ireland. More affordable northern markets generally continued to outperform London and the surrounding southern regions, where higher price-to-income ratios and greater exposure to mortgage costs constrained growth. Northern Ireland remained the strongest-performing market by a wide margin, but its sustained outperformance has contributed to deteriorating affordability, contrasting with the gradual improvement recorded across the UK as a whole.
Average house price, by submarket:
| Average House Price, Q2 2026, GBP |
Average House Price, Q2 2026, USD |
YoY, % | |
| North | GBP 173,756 | USD 233,354 | 3.88% |
| Yorkshire and The Humber | GBP 217,518 | USD 292,126 | 2.93% |
| North West | GBP 231,415 | USD 310,790 | 3.94% |
| East Midlands | GBP 240,482 | USD 322,968 | 1.76% |
| West Midlands | GBP 256,592 | USD 344,603 | 3.22% |
| East Anglia | GBP 274,375 | USD 368,485 | 0.33% |
| Outer South East | GBP 341,175 | USD 458,197 | 0.13% |
| Outer Metropolitan | GBP 432,173 | USD 580,409 | 0.25% |
| London | GBP 540,903 | USD 726,433 | 1.59% |
| South West | GBP 310,429 | USD 416,907 | 0.67% |
| Wales | GBP 220,337 | USD 295,912 | 3.46% |
| Scotland | GBP 195,928 | USD 263,132 | 3.50% |
| Northern Ireland | GBP 226,699 | USD 304,457 | 8.63% |
| Note: Exchange rate as of Q2 2026, USD 1 = GBP 0.74460. | |||
| Data Source: Nationwide BS. | |||
The near-term outlook remains subdued, and forecasts have been revised down as higher borrowing costs and economic uncertainty continue to weigh on demand. Knight Frank expects mainstream UK prices to increase by just 1.5% in 2026, followed by growth of 3.0% in 2027 and 4.0% in 2028. Savills is more cautious, forecasting a 2.0% decline in 2026, with the greatest pressure expected in London and the South East, but still anticipates cumulative UK price growth of 18.5% between 2026 and 2030. CBRE similarly expects growth to slow in 2026 due to elevated stock levels and mortgage-rate uncertainty, followed by a stronger medium-term recovery supported by an improving economy and persistent housing undersupply.
Historic Perspective
Underlying Market Dynamics from Pre-Crisis Highs to Post-Pandemic Shifts
The UK housing market expanded rapidly in the years preceding the global financial crisis, supported by strong economic growth, low borrowing costs, and readily available mortgage credit. Growth was particularly pronounced in London and the South East, where domestic demand was reinforced by international investment.
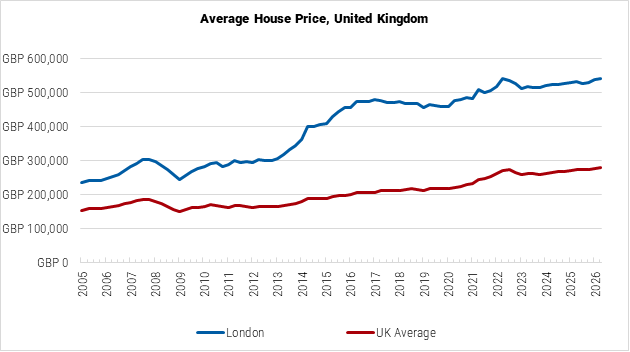
The financial crisis brought the expansion to an abrupt end as lending conditions tightened and housing activity contracted. The subsequent recovery was initially slow, reflecting weak economic growth, cautious lending, and subdued household confidence. National prices did not regain their pre-crisis level until 2014, although London recovered earlier and led the initial upswing.
Growth strengthened between 2013 and 2016 as exceptionally low interest rates, improving credit availability, and limited housing supply supported demand. Momentum weakened following the Brexit referendum, which introduced economic and political uncertainty and weighed particularly heavily on London. Nevertheless, national prices continued to rise moderately through 2019, supported by low mortgage rates and persistent housing shortages.
The pandemic marked another turning point. Although restrictions initially disrupted transactions, extensive policy support, exceptionally low mortgage rates, and the Stamp Duty holiday generated a rapid rebound. Remote working also increased demand for larger homes and more space, shifting activity towards suburban, rural, and comparatively affordable regional markets. Prices consequently rose rapidly through 2021 and most of 2022, while London generally underperformed the wider market.
The sharp rise in inflation and interest rates ended this expansion in late 2022. Higher mortgage costs weakened affordability and reduced buyer demand, pushing prices lower during 2023. However, the correction was considerably smaller than during the global financial crisis, partly because employment remained resilient, mortgage arrears were contained, and forced selling was limited.
Conditions began to improve in 2024 as mortgage pricing eased and household incomes increased, allowing prices to return to moderate growth. The recovery subsequently lost momentum during 2025 as affordability pressures and uncertainty over interest rates continued to weigh on demand. Growth improved modestly during the first half of 2026, but prices remained only slightly above their previous 2022 peak.
Data Source: Nationwide BS.
Property Demand Trends
Buyer Activity Remains Subdued Despite Early Signs of Stabilization
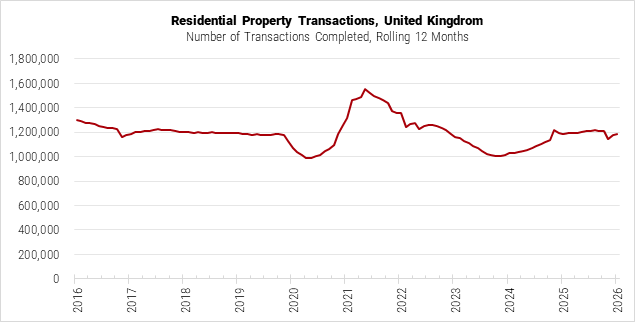
UK housing demand remained subdued during the first half of 2026, as higher mortgage costs and continued economic and political uncertainty weighed on buyer confidence, although recent indicators suggest that the downturn may be starting to ease. According to preliminary figures from HM Revenue & Customs (HMRC), non-seasonally adjusted residential transactions increased by 12.8% year-on-year in May 2026, following a 51.6% rise in April and a 38.4% decline in March. These sharp movements largely reflect changes to Stamp Duty Land Tax thresholds from April 2025, which encouraged buyers to bring purchases forward into March and subsequently depressed activity in April and May last year.
Data Source: HMRC.
Across the first five months of 2026, approximately 449,000 residential transactions were completed, 6.2% fewer than during the same period in 2025. England accounted for 84.8% of the total and recorded the largest decline, at 7.1%. However, HMRC notes that completions typically lag accepted offers by two to four months and therefore do not fully reflect current demand.
Residential property transactions, by submarket:
| Completed Residential Property Transactions, Jan-May 2026 |
Completed Residential Property Transactions, Jan-May 2025 |
YoY, % Jan-May 2026 vs Jan-May 2025 |
|
| England | 380,920 | 410,070 | -7.11% |
| Scotland | 37,930 | 38,040 | -0.29% |
| Wales | 20,160 | 20,050 | 0.55% |
| Northern Ireland | 9,990 | 10,310 | -3.10% |
| UK Total | 449,000 | 478,470 | -6.16% |
| Data Source: HMRC. | |||
More timely indicators point to continued weakness, albeit with tentative signs of stabilization. The June 2026 RICS survey recorded a new buyer-enquiries balance of -29%, improving from -34% in the previous two months, while newly agreed sales remained subdued at -32%. Respondents continued to highlight inflation, living costs, borrowing costs, and political and geopolitical uncertainty as the main constraints on confidence.
RICS Head of Market Research & Analysis Tarrant Parsons said that the results offered “some cautious encouragement” that the worst of the slowdown might be passing, but warned that any improvement remained fragile. Zoopla similarly reported that sales agreed were around 7% below last year in June, while buyer enquiries were approximately 15% lower. Activity remained comparatively resilient in northern England and Scotland, where affordability pressures are lower, while flats and several southern markets continued to underperform.
The near-term outlook remains muted. The RICS three-month sales-expectations balance rose to -16% in June, from a recent low of -34% in March, indicating that respondents expect the decline in activity to moderate. Its twelve-month reading of +1% points to broadly flat sales volumes over the coming year. Savills forecasts around 1.15 million mainstream second-hand transactions in 2026, down from 1.175 million in 2025, before a modest recovery in 2027 as borrowing costs and affordability gradually improve.
Property Supply Trends
Housebuilding Well Below Government Ambitions
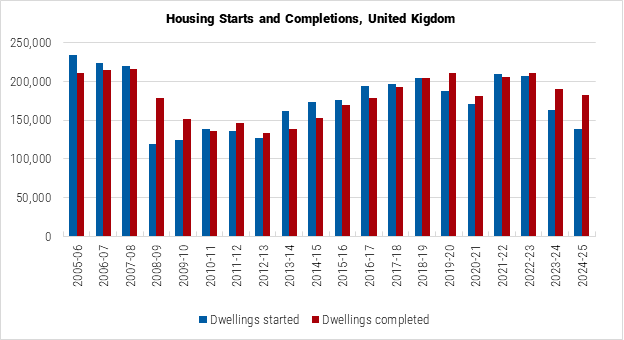
UK housebuilding activity remains subdued, with the recent improvement in starts yet to translate into a meaningful recovery in completions. Elevated construction costs, weak development viability, planning delays, and building-safety requirements continue to constrain new supply.
According to the Office for National Statistics (ONS), 138,990 dwellings were started across the UK during the 2024/25 financial year, down 15.4% from the previous year. Completions declined more moderately, by 4.4% to 182,060 units. Activity subsequently showed some improvement: in Q4 2025, starts reached 38,020 units, broadly unchanged quarter-on-quarter but up 19.1% year-on-year, while completions totaled 49,250 units and remained broadly stable from a year earlier. England accounted for approximately 84% of both starts and completions.
Data Source: ONS.
New dwelling starts and completions by submarket:
| Housing Starts | Housing Completions | |||||
| Q4 2025 | QoQ, % Q4 2025 vs Q3 2025 |
YoY, % Q4 2025 vs Q4 2024 |
Q4 2025 | QoQ, % Q4 2025 vs Q3 2025 |
YoY, % Q4 2025 vs Q4 2024 |
|
| England | 32,100 | 1.13% | 25.54% | 41,570 | 34.44% | 1.76% |
| Wales | 770 | -41.22% | 1.32% | 1,810 | 72.38% | 41.41% |
| Scotland | 4,070 | 26.79% | 0.49% | 4,230 | 3.93% | -20.79% |
| Northern Ireland | 1,080 | -31.65% | -29.87% | 1,640 | 18.84% | 0.61% |
| UK Total | 38,020 | 0.50% | 19.11% | 49,250 | 31.65% | 0.31% |
| Data Source: ONS. | ||||||
The wider development environment remains challenging. EUROCONSTRUCT identified historically weak planning approvals, prolonged consent periods, limited local-authority capacity, and persistently high material and labor costs as key barriers to construction. It also noted that Building Safety Act requirements, affordable-housing obligations, and weak sales have placed particular pressure on the viability of larger urban schemes, especially in London.
The government remains committed to delivering 1.5 million additional homes in England during the current Parliament, supported by mandatory local housing targets, planning reform, and the GBP 39 billion Social and Affordable Homes Programme. However, the government estimated that 392,400 net additional homes had been delivered between the beginning of Parliament in July 2024 and mid-June 2026, around 26% of the target. Savills expects completions in England to average around 167,500 homes annually over the coming years, well below the approximately 300,000 per year required to meet the government’s ambition. While planning reforms, improving sales conditions, and increasing affordable-housing funding should gradually support construction, a material recovery is unlikely before the latter part of the decade.
Rental Market: Rents and Rental Yields
Continued, Albeit Moderating, Growth in Rents Amid Constrained Supply
United Kingdom's rent price index:
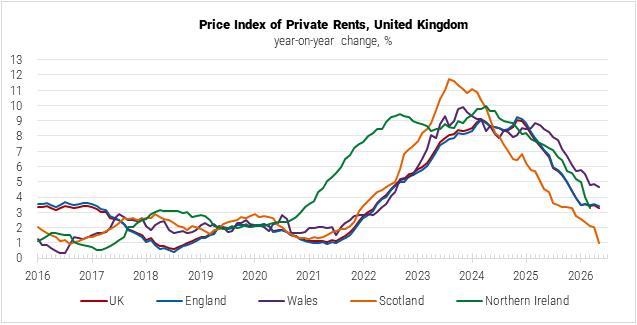
Amid persistent affordability pressures and lower migration levels due to the tightening of visa and permanent residency requirements, rental inflation across the UK continued to moderate throughout the second half of 2025 and early 2026. According to the latest figures from the Office for National Statistics (ONS), the nationwide Price Index of Private Rents (PIPR) recorded a 3.3% annual increase in May 2026, down from 7.0% a year ago in May 2025. Regionally, the lowest rental inflation for the period was observed in Scotland (1.0%), which continued to track below England (3.4%) and Wales (4.7%). The most recent available data for Northern Ireland similarly points to a notable softening in rent growth, with the year-on-year rate falling to 3.3% as of March 2026.
Data Source: ONS.
At the same time, market fundamentals in the country remain defined by a persistent imbalance between tenant demand and constrained rental supply, which is expected to sustain further rent growth, albeit less pronounced than in the previous years. One of the country’s largest property platforms, Zoopla, notes that rental supply remains 20-30% below pre-pandemic levels in every region, supporting continued rental growth across the country. The platform anticipates rental inflation for new lets in the UK to remain around 2-3% throughout the rest of 2026.
A similar assessment was presented in the June 2026 market survey by the Royal Institution of Chartered Surveyors (RICS). “Against this [supply-demand] imbalance, near-term rental price expectations remain consistent with further rent increases in the months ahead,” said the report from RICS, adding that rental growth over the next twelve months is projected at around 2.5%.
An analysis from Knight Frank also highlights the impact of the Renters’ Rights Act of 2025 (RRA), which introduced a number of tenant protections, including new rules for rent-setting and rent increases, and prompted “a growing number of landlords” to sell their properties, “pushing supply lower and rents higher in many areas of London”.
Average private rent, by submarket:
| Average Private Rent, May 2026, GBP |
Average Private Rent, May 2026, USD |
YoY, % May 2026 vs May 2025 |
|
| England | GBP 1,442 | USD 1,946 | 3.4% |
| East of England | GBP 1,280 | USD 1,728 | 3.6% |
| East Midlands | GBP 914 | USD 1,234 | 3.7% |
| London | GBP 2,294 | USD 3,096 | 2.0% |
| North East | GBP 776 | USD 1,047 | 5.9% |
| North West | GBP 954 | USD 1,288 | 5.4% |
| South East | GBP 1,418 | USD 1,914 | 2.9% |
| South West | GBP 1,234 | USD 1,666 | 5.1% |
| West Midlands | GBP 966 | USD 1,304 | 4.2% |
| Yorkshire and The Humber | GBP 856 | USD 1,155 | 4.5% |
| Wales | GBP 836 | USD 1,128 | 4.7% |
| Scotland | GBP 1,009 | USD 1,362 | 1.0% |
| Northern Ireland* | GBP 876 | USD 1,182 | 3.3% |
| *Data for Northern Ireland is for March 2026. | |||
| Note: Exchange rate as of May 2026, GBP 1 = USD 1.3498. | |||
| Data Source: ONS. | |||
In nominal terms, based on ONS figures, the average private rent in the UK reached GBP 1,383 (USD 1,867) in May 2026. By unit size, the indicator ranged from GBP 1,123 (USD 1,516) for one-bedroom units to GBP 1,266 (USD 1,709) for two-bedroom units, GBP 1,413 (USD 1,970) for three-bedroom units, and GBP 2,056 (USD 2,775) for units with four or more bedrooms. The highest average rents were traditionally observed in the region of London, followed by the South East, the East of England, and the South West. The North East reported the lowest average rent level.
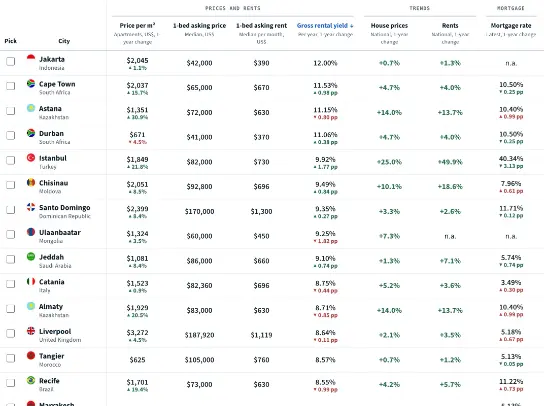
As for gross rental yields for residential properties in the UK, research by Global Property Guide found them at an average of 7.35% in June 2026, up from 7.03% previously reported in June 2025. The highest potential performance among the surveyed submarkets was estimated for rental properties in Liverpool (8.64%), Birmingham (8.41%), and Glasgow (8.31%), while the lowest yields were observed in Edinburgh (5.90%). In London, yields were estimated to average 6.62%.
Mortgage Market and Interest Rates
Borrowing Costs Expected to Remain Elevated, Outlook for Lending Activity Uncertain
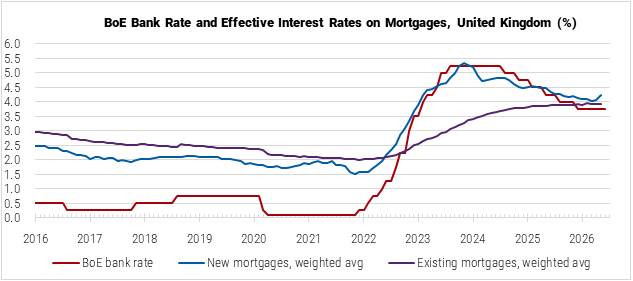
After a series of cuts throughout the second half of 2024 and 2025, the Bank of England (BoE) has held its bank rate at 3.75% since December, making no adjustments at its latest policy meeting amid heightened inflationary pressures brought by the Middle East conflict. While the median forecast from the economists polled by Reuters in June was for the BoE to keep the benchmark at its current level through the rest of 2026, a growing number of experts now believe at least one rate hike is possible before the end of the year.
United Kingdom's mortgage loan interest rates:
In this environment, mortgage interest rates in the country, which have been edging lower for new loans and stabilizing for existing loans over the past year, are expected to remain elevated with no substantial declines likely in the near future. In May 2026, the BoE reported the average effective interest rate on new mortgages at 4.22%, below the corresponding period in 2025 but up from a recent low of 4.03% recorded in March. For existing mortgages, the indicator stood at 3.92%, marginally up from a year ago.
“The Bank of England has held interest rates at 3.75% since the start of 2026 as it takes a cautious approach to rising inflation, meaning mortgage rates are unlikely to get significantly cheaper any time soon,” the financial news outlet MoneyWeek summarized in its latest property market forecast.
At the same time, the HomeOwners Alliance, a local consumer advocacy organization, expressed overall optimism for mortgage pricing in a recent forecast, noting that they are seeing the beginnings of a “mortgage price war” among individual lenders in the UK, although the outlook remains uncertain due to global and domestic factors.
Data Source: BoE.
Effective interest rates on mortgage loans to individuals, monthly weighted average:
| May 2026 | YoY | May 2025 | YoY | May 2024 | |
| New mortgages | 4.22% | ↓ | 4.47% | ↓ | 4.79% |
| - Floating rate | 4.43% | ↓ | 4.97% | ↓ | 5.95% |
| - Fixed rate | 4.20% | ↓ | 4.43% | ↓ | 4.72% |
| - IRF up to 5 years | 4.20% | ↓ | 4.43% | ↓ | 4.72% |
| - IRF from 5 to 10 years | 4.26% | ↑ | 4.10% | ↑ | 4.07% |
| - IRF over 10 years | n/a | n/a | n/a | n/a | 3.02% |
| Existing mortgages | 3.92% | ↑ | 3.87% | ↑ | 3.61% |
| - Floating rate | 5.17% | ↓ | 5.90% | ↓ | 6.81% |
| - Fixed rate | 3.80% | ↑ | 3.66% | ↑ | 3.19% |
| - IRF up to 5 years | 3.84% | ↑ | 3.69% | ↑ | 3.21% |
| - IRF from 5 to 10 years | 2.81% | ↑ | 2.74% | ↑ | 2.70% |
| - IRF over 10 years | 2.74% | ↓ | 2.77% | ↑ | 2.76% |
| Data Source: BoE. | |||||
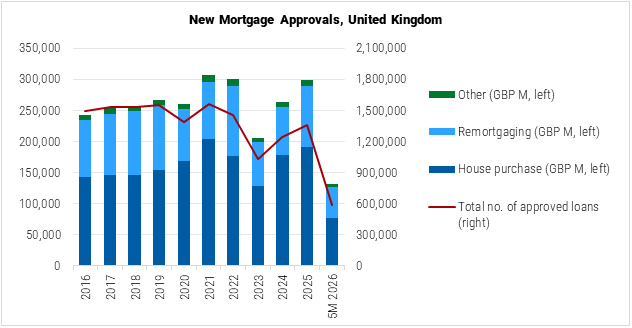
Supported by earlier declines in interest rates, lending activity in the country continues to recover. According to the BoE, in 2025, mortgage approvals recorded a 13.4% year-on-year increase in value and a 9.5% increase in volume of new loans, although not yet approaching the respective benchmarks of 2021. The growth momentum carried into this year, with over 585 thousand loans for GBP 130.5 billion (USD 176.2 billion) approved between January and May, representing a 10.5% increase in value and an 8.1% increase in volume compared to the first five months of 2025. Of the combined value of new approvals during the period, loans for house purchase made up 59.2%, and the rest was remortgages and other types of loans.
At the same time, some experts now question how long this upward trend in new lending will last. Paul Dales, chief UK economist at Capital Economics, believes it is likely that continued growth in recent months has been driven by households “pulling forward” their planned house purchases before mortgage rates rose. “If so, mortgage approvals would soon fall back,” he said, as quoted by Reuters. “That would certainly fit more comfortably with other indicators that show housing market sentiment has soured since the war triggered a jump in mortgage rates.”
Note: Based on data on lending to individuals secured by dwellings, not seasonally adjusted.
Data Source: BoE.
The overall size of the UK’s mortgage market continues its modest expansion, having recorded annual increases of 1.5% in 2024 and 3.0% in 2025. As of May 2026, the total value of outstanding mortgages in the country's financial system stood at GBP 1.7 trillion (USD 2.3 trillion), reflecting a further 1.0% increase since the beginning of the year. At the same time, measured against the broader economy, the market has been on a long-term downward trajectory (apart from a pandemic-related spike in 2020). In 2025, the loan-to-GDP ratio was estimated to fall to 55.7% from 66.8% in 2015 and 76.5% in 2009.
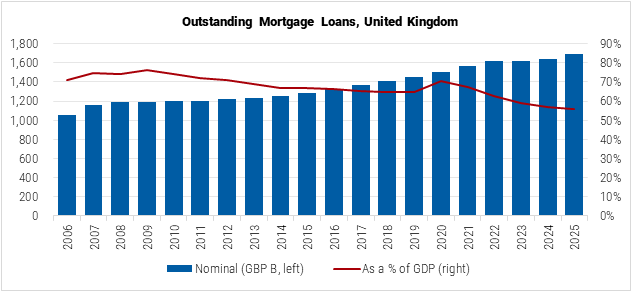
Note: Based on data on net lending to individuals secured by dwellings, not seasonally adjusted.
Data Sources: BoE, World Bank.
Economic and Social Factors
Slower Growth Prospects Amid Global and Domestic Instability
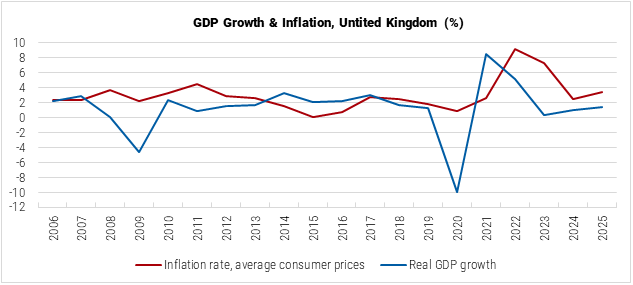
Despite significant external and domestic uncertainty, prior to the escalation in the Middle East, the UK economy was gaining momentum, with real GDP growth picking up from 1.0% in 2024 to 1.4% in 2025 on the back of a recovery in private consumption and investment. This year, growth is projected by the International Monetary Fund (IMF) to slow to 1.0% (as higher energy prices erode real incomes and tighter financial conditions weigh on demand), before gradually recovering when the energy shock dissipates.
In parallel, according to the IMF, higher energy prices are expected to push inflation up temporarily to an average of 3.2% in 2026 and 2.4% in 2027, delaying its return to the central bank’s target by about one year. In May 2026, the consumer price index inflation in the UK was reported by the ONS at 2.9%.
Data Source: IMF.
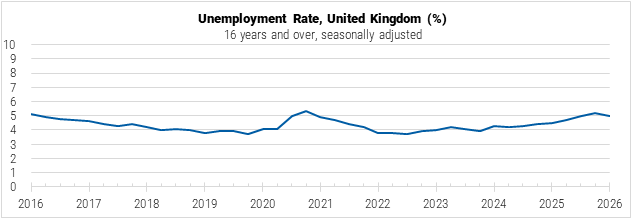
In the country’s labor market, the unemployment rate rose to 5.0% in Q1 2026 (compared to 4.5% a year prior in Q1 2025 and the 3.7% post-pandemic low in Q3 2022), while vacancies fell to the lowest level in five years, and the IMF believes the market is likely to soften further. The latest jobs report from KPMG and Recruitment & Employment Confederation (REC) noted that heightened uncertainty around the business outlook due to the Middle East conflict, as well as domestic political turbulence, has led to a fall in permanent staff recruitment, and employers in the UK are now leaning on more flexible temporary hiring.
“Ongoing global and domestic uncertainty is making businesses more cautious, and that is increasingly reflected in hiring decisions <…> Businesses need stability to plan and confidence to invest. With both still under pressure, the medium-term outlook for jobs remains subdued,” said Jon Holt, Group Chief Executive and UK Senior Partner at KPMG.
Data Source: ONS.
Overall, the UK economy has remained resilient in recent years, but as outlined in the IMF’s 2026 Article IV staff report, risks to growth are now tilted to the downside, notably from a prolonged increase in energy prices and sustained market volatility.
Adding to the heightened global uncertainty, the UK continues to experience domestic political turbulence, driven by fiscal pressures, debates over public spending and taxation, challenges in implementing housing and planning reforms, and ongoing scrutiny of the government's response to the cost-of-living crisis. In June 2026, Prime Minister Keir Starmer resigned as leader of the Labour Party and Prime Minister and has since been succeeded by Andy Burnham, who pledged to end the era of instability and deliver a new 10-year economic development plan later this year, as well as tackle the cost of living with some immediate measures.
Sources:
- UK Government
- Hundreds of Thousands to Get Secure Roof Over Their Heads: https://www.gov.uk/
- Housing Supply: Indicators of New Supply, England, January to March 2026: https://www.gov.uk/
- UK National Archives
- Renters’ Rights Act 2025: https://www.legislation.gov.uk/
- Bank of England (BoE)
- Interest Rates and Bank Rate: https://www.bankofengland.co.uk/
- Effective Interest Rates: https://www.bankofengland.co.uk/
- Household Credit: https://www.bankofengland.co.uk/
- Money and Credit, May 2026: https://www.bankofengland.co.uk/
- Monetary Policy Report, April 2026: https://www.bankofengland.co.uk/
- Office for National Statistics (ONS)
- Inflation and Price Indices: https://www.ons.gov.uk/
- Private Rent and House Prices, UK: June 2026: https://www.ons.gov.uk/
- Unemployment: https://www.ons.gov.uk/
- Vacancies and Jobs in the UK, June 2026: https://www.ons.gov.uk/
- House Building, UK: Permanent Dwellings Started and Completed by Country: https://www.ons.gov.uk/
- HM Revenue & Customs (HMRC)
- UK Monthly Property Transactions Commentary: https://www.gov.uk/
- International Monetary Fund (IMF)
- Country Overview: United Kingdom: https://www.imf.org/
- 2026 Article IV Staff Report: https://www.imf.org/
- United Kingdom: Staff Concluding Statement of the 2026 Article IV Mission: https://www.imf.org/
- World Economic Outlook Update, July 2026: https://www.imf.org/
- Nationwide Building Society
- Annual House Price Growth Edges Higher in June: https://www.nationwide.co.uk/
- Royal Institution of Chartered Surveyors (RICS)
- UK Residential Market Survey, June 2026: https://www.rics.org/
- HomeOwners Alliance
- Mortgage Rate Predictions 2026: Are Mortgage Rates Going Down?: https://hoa.org.uk/
- Zoopla
- UK Rental Market Report, June 2026: https://assets.ctfassets.net/
- House Price Index: June 2026: https://www.zoopla.co.uk/
- KPMG
- KPMG and REC, UK Report on Jobs, June 2026: https://kpmg.com/
- Savills
- Revised Mainstream House Price Forecasts: https://www.savills.co.uk/
- Mainstream Residential Forecasts 2026-2030: https://pdf.savills.com/
- Housing Completions Forecast for England – June 2026: https://www.savills.com/
- Knight Frank
- UK Residential Market Update: https://www.knightfrank.co.uk/
- Rental Market Adjusts to Reforms and Future Tax Risks: https://www.knightfrank.co.uk/
- UK Housing Market Forecast: Q2 2026: https://www.knightfrank.co.uk/
- Cushman & Wakefield
- Marketbeat Economy & Housing, June 2026: https://assets.cushmanwakefield.com/
- CBRE
- UK Residential Forecasts Q1 2026: https://www.cbre.co.uk/
- EUROCONSTRUCT
- Uk Housebuilding Hits a Wall: https://www.euroconstruct.org/
- Fitch Ratings
- Fitch Affirms United Kingdom at 'AA-'; Outlook Stable: https://www.fitchratings.com/
- Reuters
- Bank of England to Hold Interest Rates This Year but Strong Minority See a Hike: https://www.reuters.com/
- British Mortgage Approvals Rise to 15-month high, Bank of England Data Shows: https://www.reuters.com/
- New British Premier Andy Burnham Vows to End Years of Instability: https://www.reuters.com/
- Financial Times
- London Rental Affordability Improves Despite Recent Rise: https://www.ft.com/
- MoneyWeek
- What’s Happening with UK House Prices? Latest Property Forecasts for 2026: https://moneyweek.com/