South Africa's Residential Property Market Analysis 2026
South Africa's housing market began 2026 in the strongest shape it had been in for four years, then ran straight into an oil shock. House prices are still rising faster than they have since 2022, but the real return to owners is being squeezed month by month as fuel-driven inflation climbs and the Reserve Bank abandons its easing cycle.
This extended overview from the Global Property Guide presents a comprehensive analysis of South Africa's housing market, covering its overall structure, price movements, demand and supply dynamics, and regulatory environment, while placing particular emphasis on recent developments and long-term trends shaping the sector.
Table of Contents
- Property Prices and Price Index
- Historic Perspective
- Property Demand Trends
- Property Supply Trends
- Rental Market: Rents and Rental Yields
- Mortgage Market and Interest Rates
- Economic and Social Factors
Property Prices and Price Index
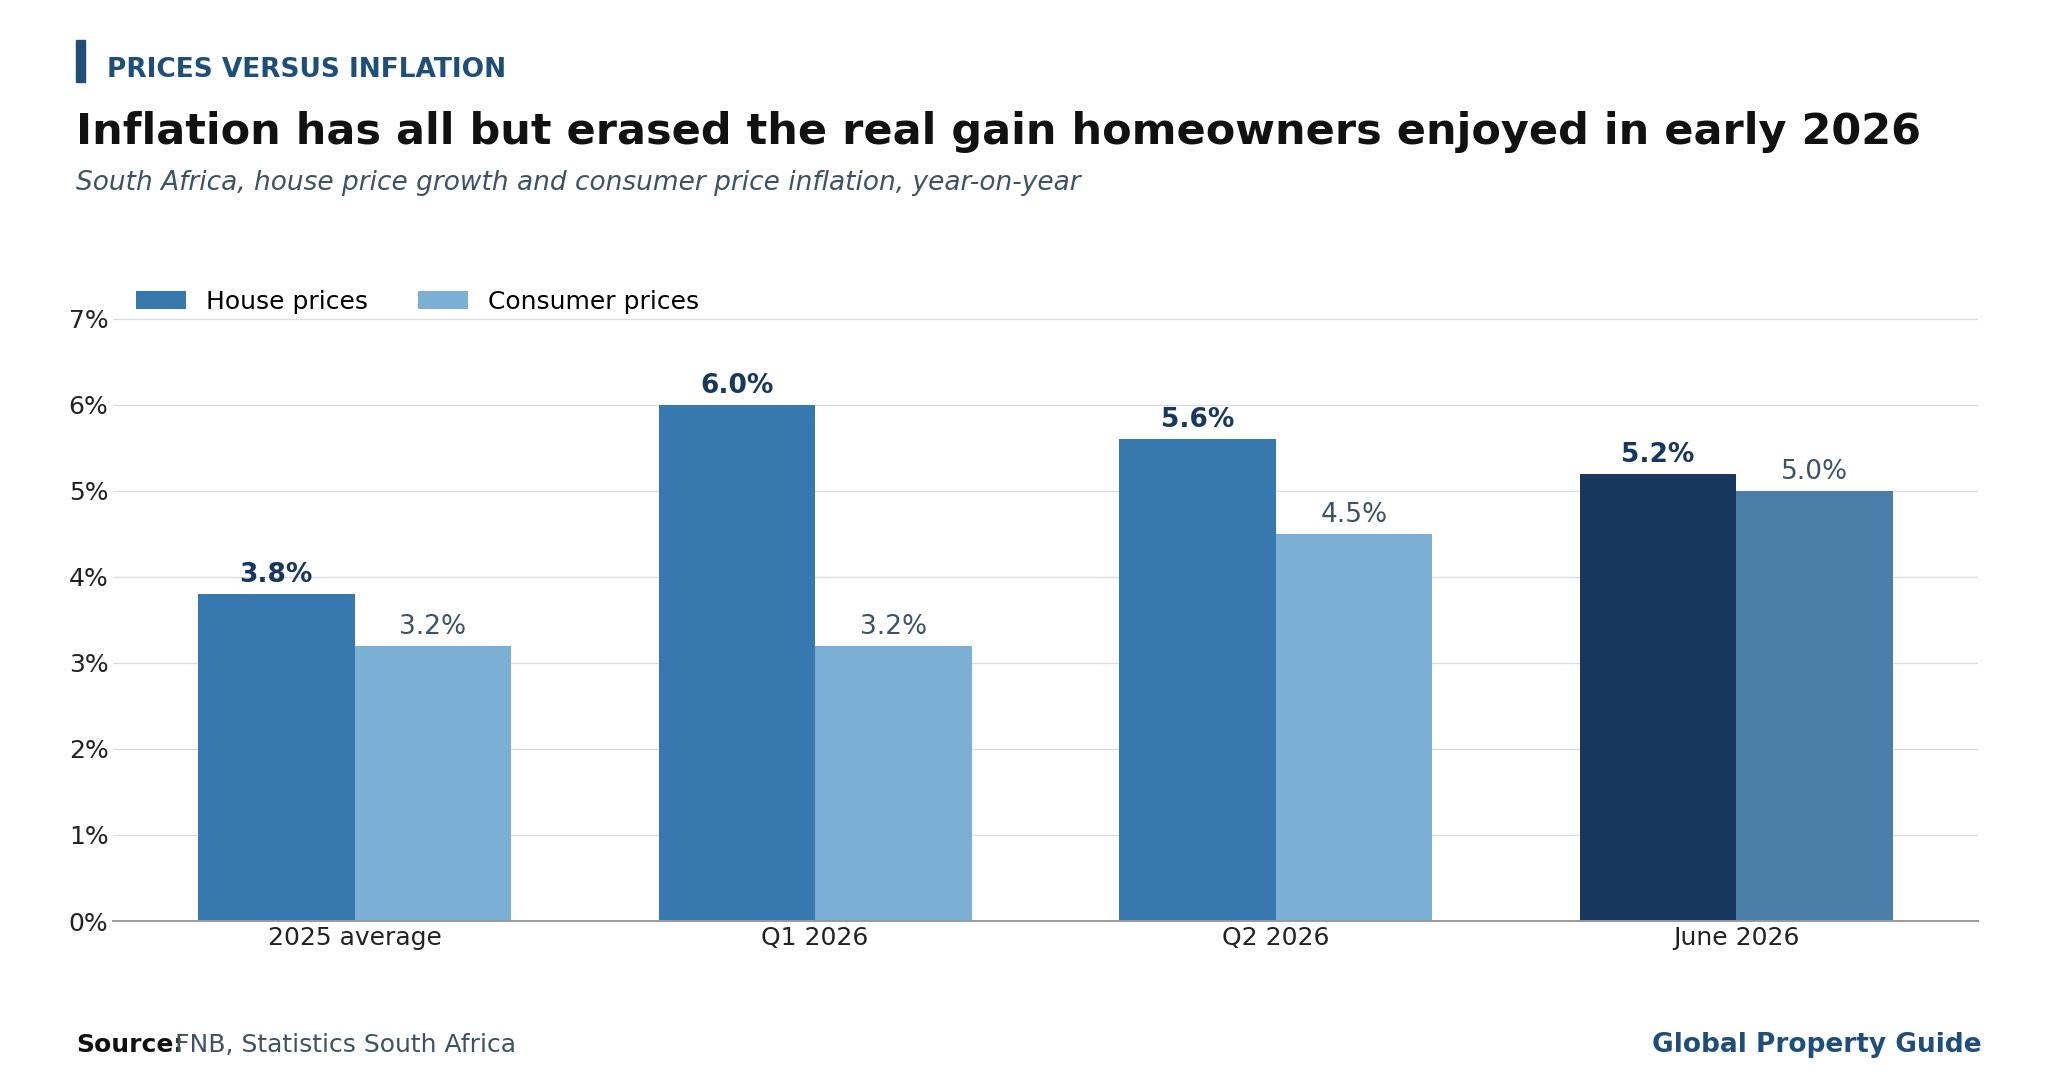
The Repeat Sales House Price Index rose by 5.2% in June 2026 compared with the same month a year earlier, easing from 5.7% in May, according to figures released by the First National Bank (FNB). Prices were flat for the month. Average growth for the second quarter came in at 5.6%, down from 6% in the first three months of the year.
Those numbers still represent the fastest sustained price growth South Africa has recorded since 2022. What has changed is what the homeowner keeps. With headline inflation reaching 5% in June, its highest reading in two years, the real gain on residential property has narrowed to roughly 0.2%. In the first quarter, when inflation was running at an average of 3.2%, the same index was delivering a real return closer to 2.7%.
South Africa's house price annual change:
FNB expects annual price growth to slow further to about 4% by the end of the year. Siphamandla Mkhwanazi, the bank's economist, attributed the moderation to a tougher operating environment rather than to any collapse in appetite for property. He noted that higher borrowing costs, weaker consumer confidence, and softer economic conditions are weighing on housing demand and are likely to restrain market activity through the remainder of the year.
Crucially, the bank does not expect prices themselves to fall. Residential development remains subdued, and fewer existing homes are being listed for sale, which is cushioning valuations. Mkhwanazi described this limited stock availability as preventing a more pronounced correction in house prices, and said it should continue to support valuations over the near term.
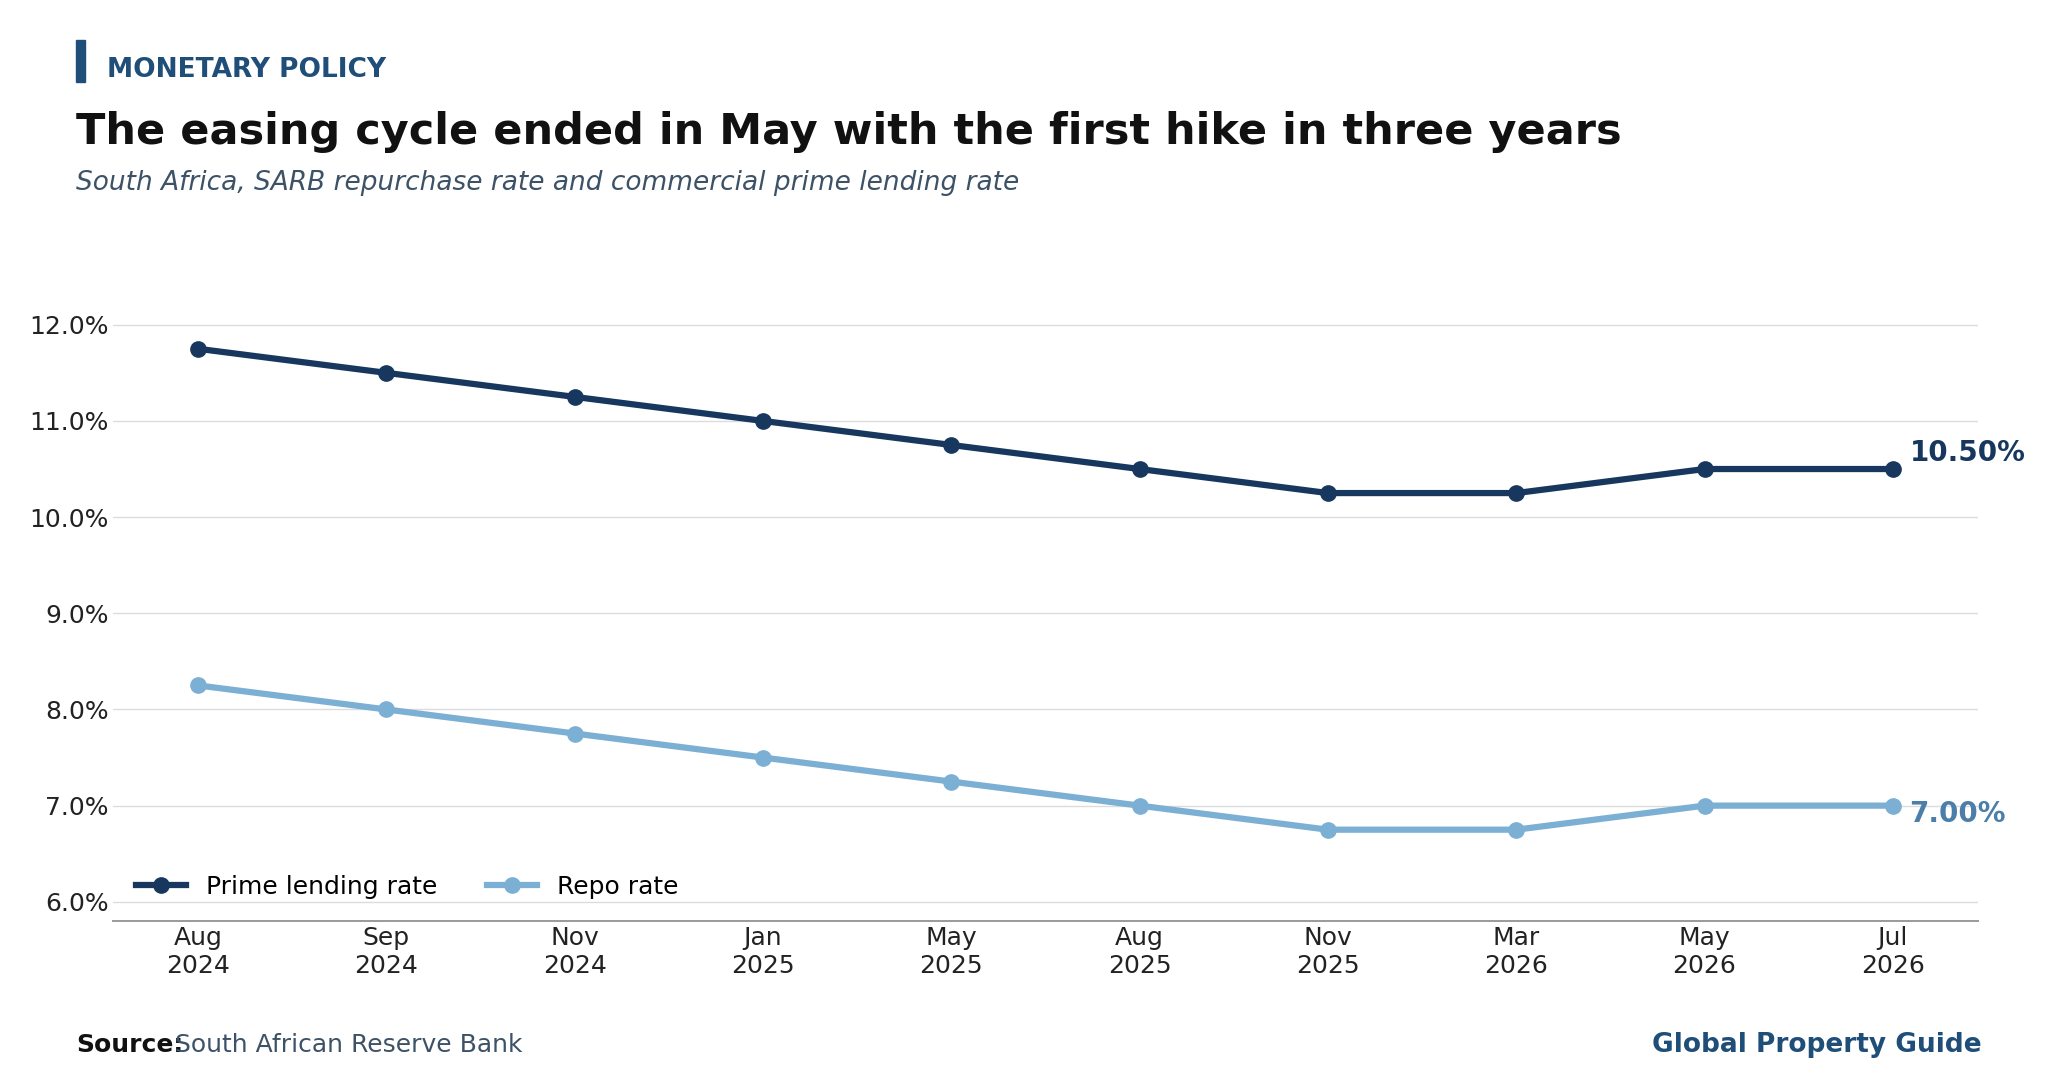
The turn in the interest rate cycle explains most of the shift in sentiment. In May 2026, the South African Reserve Bank (SARB) raised its repurchase rate by 25 basis points to 7%, the first increase since May 2023, reversing part of six consecutive cuts. At its July meeting, the Monetary Policy Committee held the rate in a four-to-two split, with two members preferring a further hike. The prime lending rate stands at 10.50%.
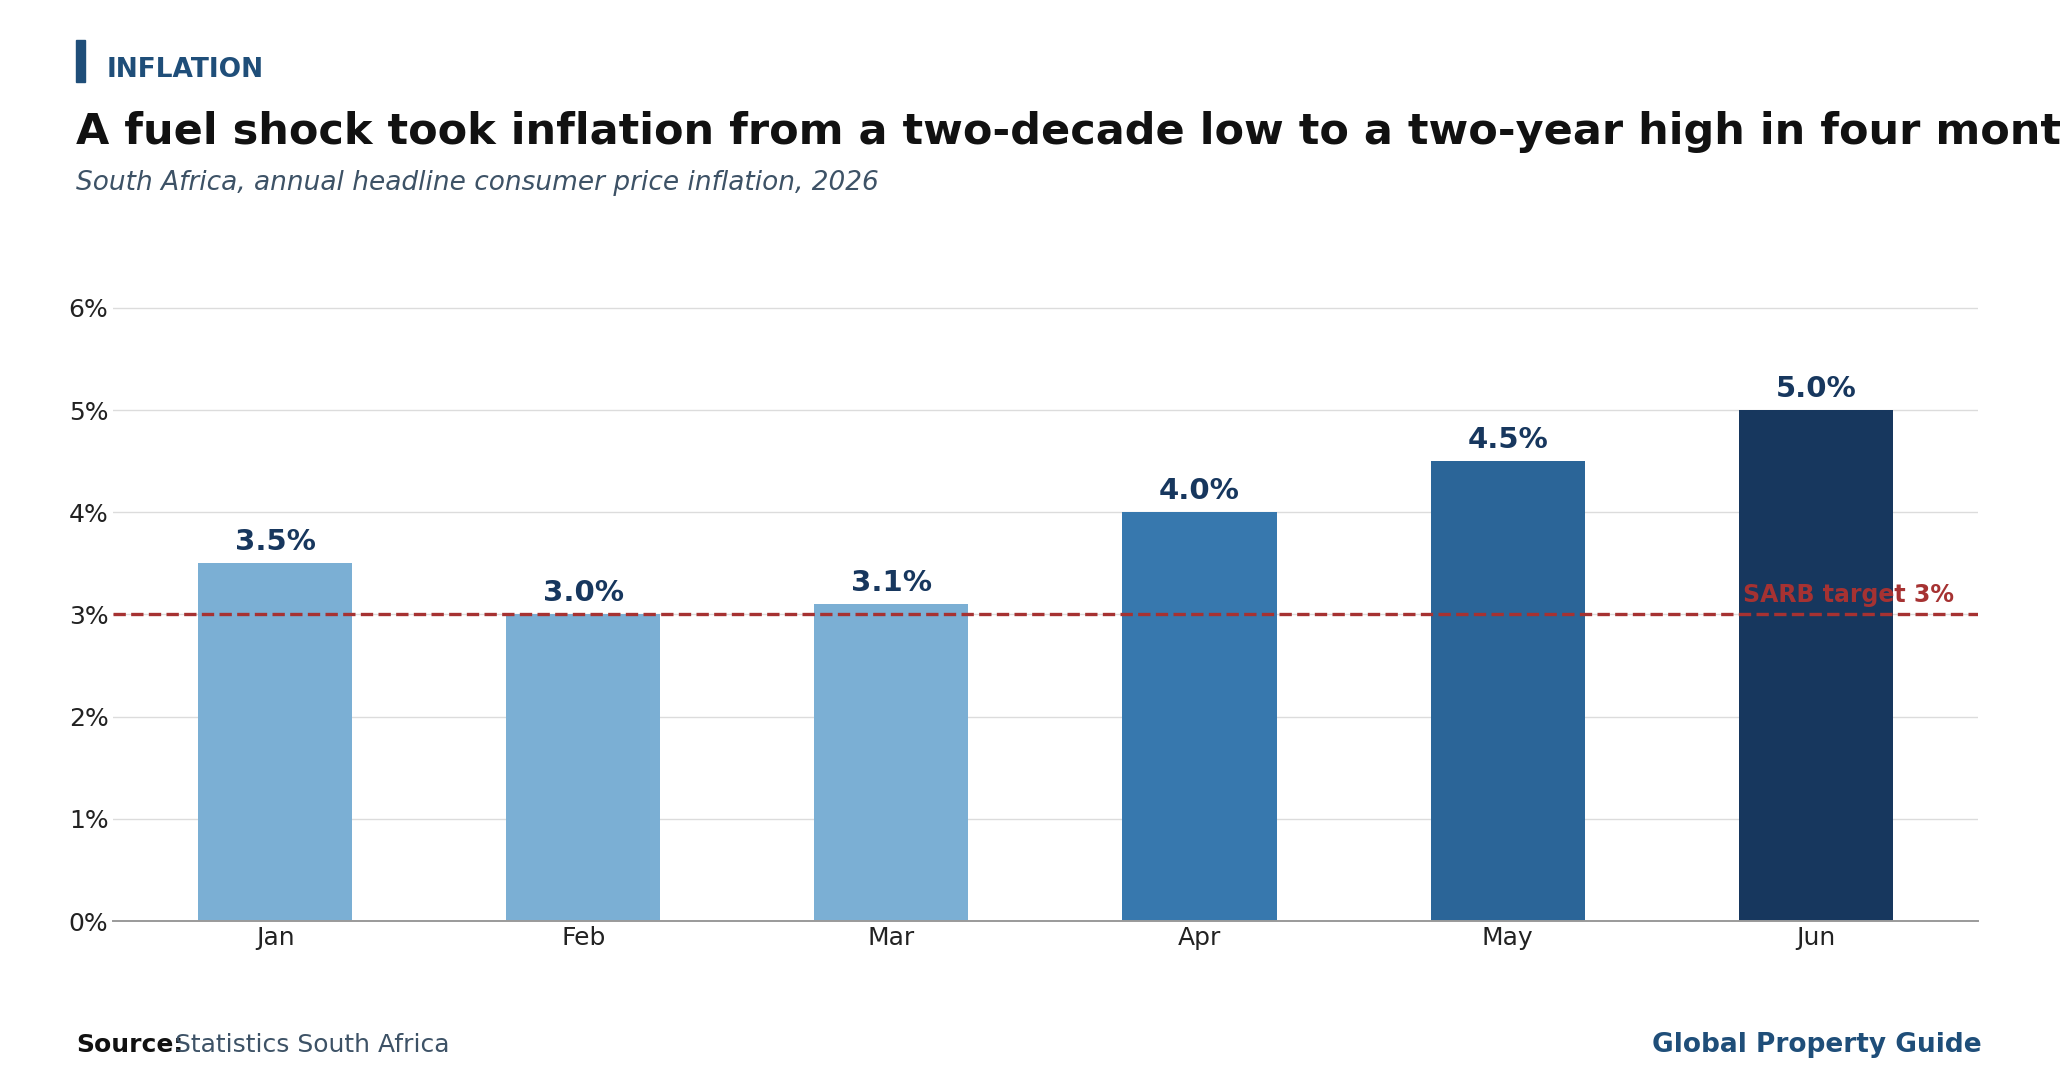
The trigger for all of this sits well outside the property market. The conflict in the Middle East, which escalated in late February, sent oil prices sharply higher and pushed South African fuel costs up by 34.3% in the twelve months to June. That single line item took transport inflation to 12.7% and dragged the headline rate from a two-decade low into breach of the SARB's 3% target.
South Africa is Africa's second-largest economy, with a population of roughly 63 million and a GDP per capita of about US$6,300 in 2024, according to the International Monetary Fund. It has substantial manufacturing and financial sectors and is the world's largest exporter of gold and platinum. Tourism remains an important source of foreign exchange.
The wider economy is finally showing signs of life. Real GDP grew by 1.1% in 2025, the strongest annual reading since 2022, and expanded by a further 0.5% quarter on quarter in the first three months of 2026, a sixth consecutive quarter of growth. On an annual basis, output was 1.9% higher than a year earlier.
Historic Perspective
Recalling the boom years
During South Africa's housing boom, from 2000 to 2006, house prices rose by an average of 20% annually. These increases peaked in October 2004 with 35.7% annual growth, or 32.5% in real terms, according to ABSA.
The boom was driven by four main factors:
- The emergence of a financially stable black middle class, which had a tremendous impact on housing demand, was encouraged by individual tax reliefs in the context of a growing economy.
- South Africans who had parked money offshore during the Apartheid era were allowed, and required, to bring it back by September 2004. Much of this money went into property.
- Better stability and security helped. During Apartheid and its sequel, property prices had badly lagged the economy as the security situation went from bad to worse.
- The Financial Sector Charter in 2003 boosted mortgage loan growth. Financial institutions are committed to providing ZAR 42 billion of housing finance to the low-income market. In 2006, the capital gains tax exemption on primary residences was raised from ZAR 1 million to ZAR 1.5 million, and transfer duties on properties were lowered.
The boom ground to a halt following the global financial crisis. From 2008 to 2009, house prices fell by 3.2%, or 16.5% in real terms. Aside from the global crisis and rising interest rates, the decline was prompted by the implementation of the National Credit Act in mid-2007, which aimed to protect borrowers from over-indebtedness by limiting how much could be borrowed and requiring every lender to assess a borrower's creditworthiness. The act tended to reduce the supply of mortgage loans.
The housing market rose a little in 2010, encouraged by South Africa hosting the 19th FIFA World Cup, and from 2011 to 2019, house prices rose by almost 51%. After the ravages of inflation are deducted, that works out at a meagre 0.4% growth in real terms.
House prices rose by a total of 8% in 2020 and 2021, amidst the Covid-19 pandemic, yet when adjusted for inflation, prices actually declined by 1.1% over the same period. During 2022, nominal house prices rose by a modest 3.2% but fell by 4% in real terms.
The market then spent three years going backwards in real terms, with prices increasing by a minuscule 1% in 2023 and just 1.2% in 2024, equivalent to real declines of 4% and 1.69% respectively.
2025 broke that run. The FNB index averaged 3.8% for the year and reached a cyclical high of 5.3% in October, its fastest pace in more than three years. With inflation averaging 3.2%, the lowest in over two decades, real house prices rose by roughly 0.6%. It was the first inflation-adjusted gain since 2020, and it arrived without the credit expansion that has typically accompanied South African upswings.
| HOUSE PRICES, ANNUAL CHANGE (%) | ||
| Year | Nominal | Inflation-adjusted |
| 2008 | -5.08 | -13.16 |
| 2009 | 2.03 | -3.90 |
| 2010 | 3.10 | -0.23 |
| 2011 | 4.36 | -1.84 |
| 2012 | 5.77 | -0.04 |
| 2013 | 7.72 | 2.35 |
| 2014 | 6.20 | 0.82 |
| 2015 | 6.32 | 1.08 |
| 2016 | 4.75 | -2.16 |
| 2017 | 3.85 | -0.62 |
| 2018 | 4.12 | -0.27 |
| 2019 | 3.10 | -0.90 |
| 2020 | 4.10 | 0.99 |
| 2021 | 3.70 | -2.06 |
| 2022 | 3.20 | -4.00 |
| 2023 | 1.00 | -4.00 |
| 2024 | 1.20 | -1.69 |
| 2025 | 3.80 | 0.58 |
| Data Sources: FNB, Statistics South Africa, Global Property Guide | ||
Property Demand Trends
Activity has moderated, but this is a pause rather than a reversal
Buyer appetite held up better through the first half of 2026 than the interest rate reversal might have suggested. Data released by ooba Home Loans shows that while the number of bond applications in the second quarter fell by 1.5% from a year earlier, their combined value rose by 4.7%. The average purchase price increased by 4.2% to ZAR 1.77 million (US$107,300), and the average approved bond rose by 5%.
Rhys Dyer, chief executive of the ooba Group, framed the slowdown as an affordability story rather than a demand story. He argued that some moderation in activity was to be expected given the pressure on household budgets, but that the data points to a pause rather than a reversal, with application volumes easing slightly while total application value continued to trend higher.
First-time buyers have been the surprise of the year. Their average purchase price climbed by 6.1% to ZAR 1.32 million (US$80,000) and their average approved bond rose by 7.9%, both well ahead of the market as a whole. Banks have also relaxed the entry requirements. The average deposit paid by a first-time buyer fell to 8.9% of the purchase price from 10.4% a year earlier, and zero-deposit mortgages accounted for more than 56.9% of all applications in the first half of the year.
Regional performance has diverged sharply. Johannesburg recorded the strongest house price growth over the first half at 10.1%, followed by Limpopo at 9.6%. The Free State had the highest first-time buyer participation, with that segment accounting for 69% of all home loan applications there.
Not every indicator is pointing the same way. FNB's second-quarter estate agent survey found that affordability had become a growing constraint, with first-time and lower-income buyers hampered by financial constraints and firmer lending requirements. The tension between generous bank terms at the point of approval and tighter household cash flow after the fuel price shock is the defining feature of demand this year.
Foreign buyers dominate the top of the market
New research from Lightstone has recalibrated how the foreign buyer question should be understood. Across roughly 2.39 million residential transactions recorded between 2016 and 2025, foreign buyers accounted for about 6% of the total. The analysis covers purchases by individuals and excludes companies and trusts.
That headline share conceals an extreme concentration by price. Foreign buyers made up 15% of transactions for homes priced between ZAR 4 million and ZAR 10 million, 26% for properties worth ZAR 10 million to ZAR 20 million, and 39% for anything above ZAR 20 million (US$1.21 million).
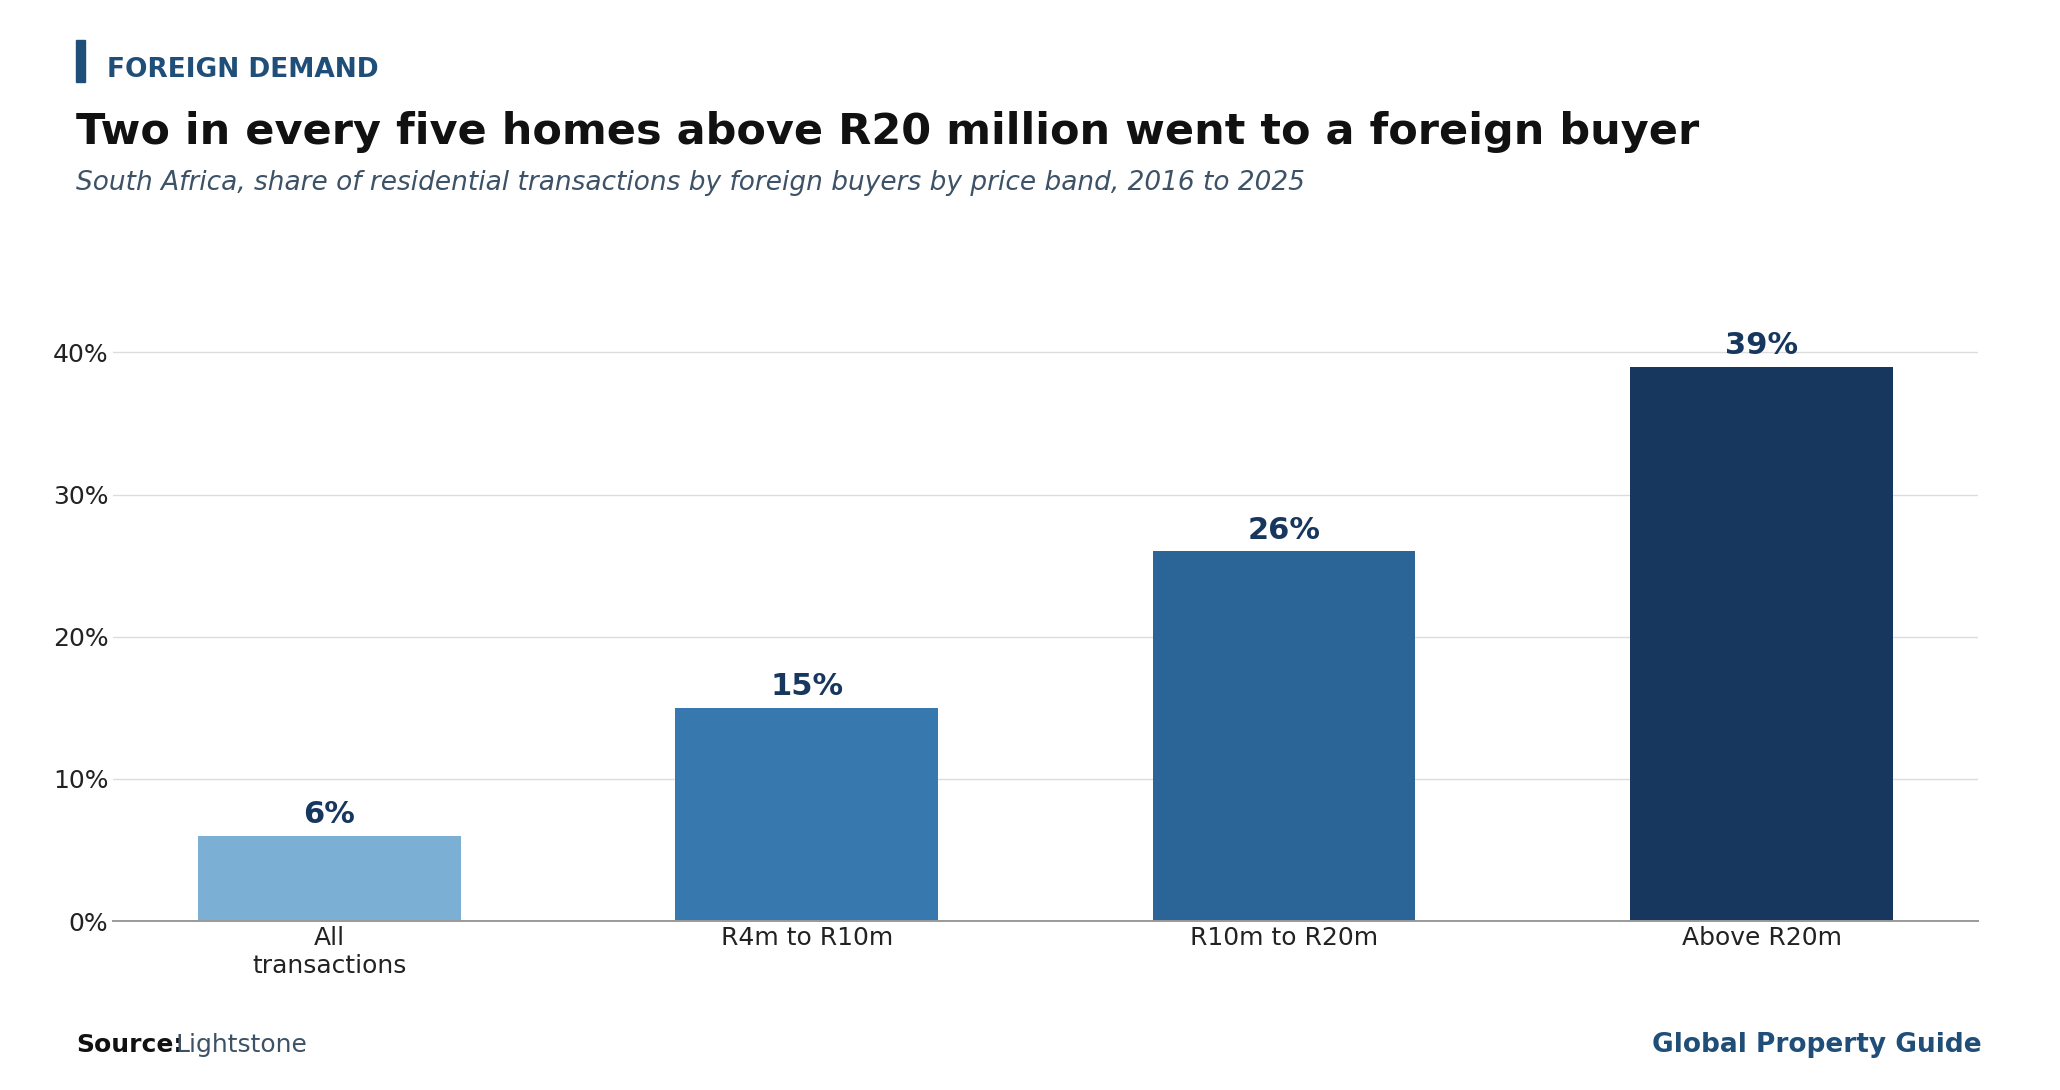
Hayley Ivins-Downes, managing executive for real estate services at Lightstone, put it plainly: two out of every five homes valued at more than ZAR 20 million were bought by a foreign buyer.
The geography is less predictable than the stereotype allows. The Western Cape recorded the highest provincial share of foreign buyers at 7.8%, but Gauteng followed closely at 7.3%. For homes valued above ZAR 1 million, Johannesburg actually overtook Cape Town, with foreign buyers accounting for 15.3% of transactions against 12.7% in the Mother City.
In absolute terms, Cape Town remains the country's magnet for foreign capital, absorbing an estimated ZAR 153 billion (US$9.27 billion) of residential purchases over the decade, compared with ZAR 107 billion (US$6.48 billion) in Johannesburg. The concentrations on the Atlantic Seaboard are striking. In Llandudno, nearly two-thirds of homes sold over the period went to foreign buyers at an average price of ZAR 29.2 million (US$1.77 million). Bakoven, Camps Bay, Constantia, and Bishopscourt also recorded high levels of foreign participation.
Ivins-Downes cautioned against reading all of this as leisure buying. She noted that Johannesburg's established immigrant communities have driven significant activity, while lifestyle markets in the Western Cape and Limpopo continue to attract affluent international purchasers. Beyond the Western Cape, foreign buyers were active in Limpopo's game estate market around Hoedspruit, in lifestyle towns such as McGregor and Riebeek Kasteel, on KwaZulu-Natal's North Coast, and in Johannesburg suburbs including Mayfair, Cyrildene, and Yeoville.
Foreigners can own immovable property in South Africa without restriction. All foreign funds remitted to the country must be declared and documented, and the property must be endorsed as non-resident as a condition for the repatriation of funds. Non-resident sellers pay capital gains tax, with the purchaser required to withhold a prescribed percentage of the proceeds and remit it directly to the South African Revenue Service before paying the balance to the seller.
Property Supply Trends
Construction is recovering from a very low base
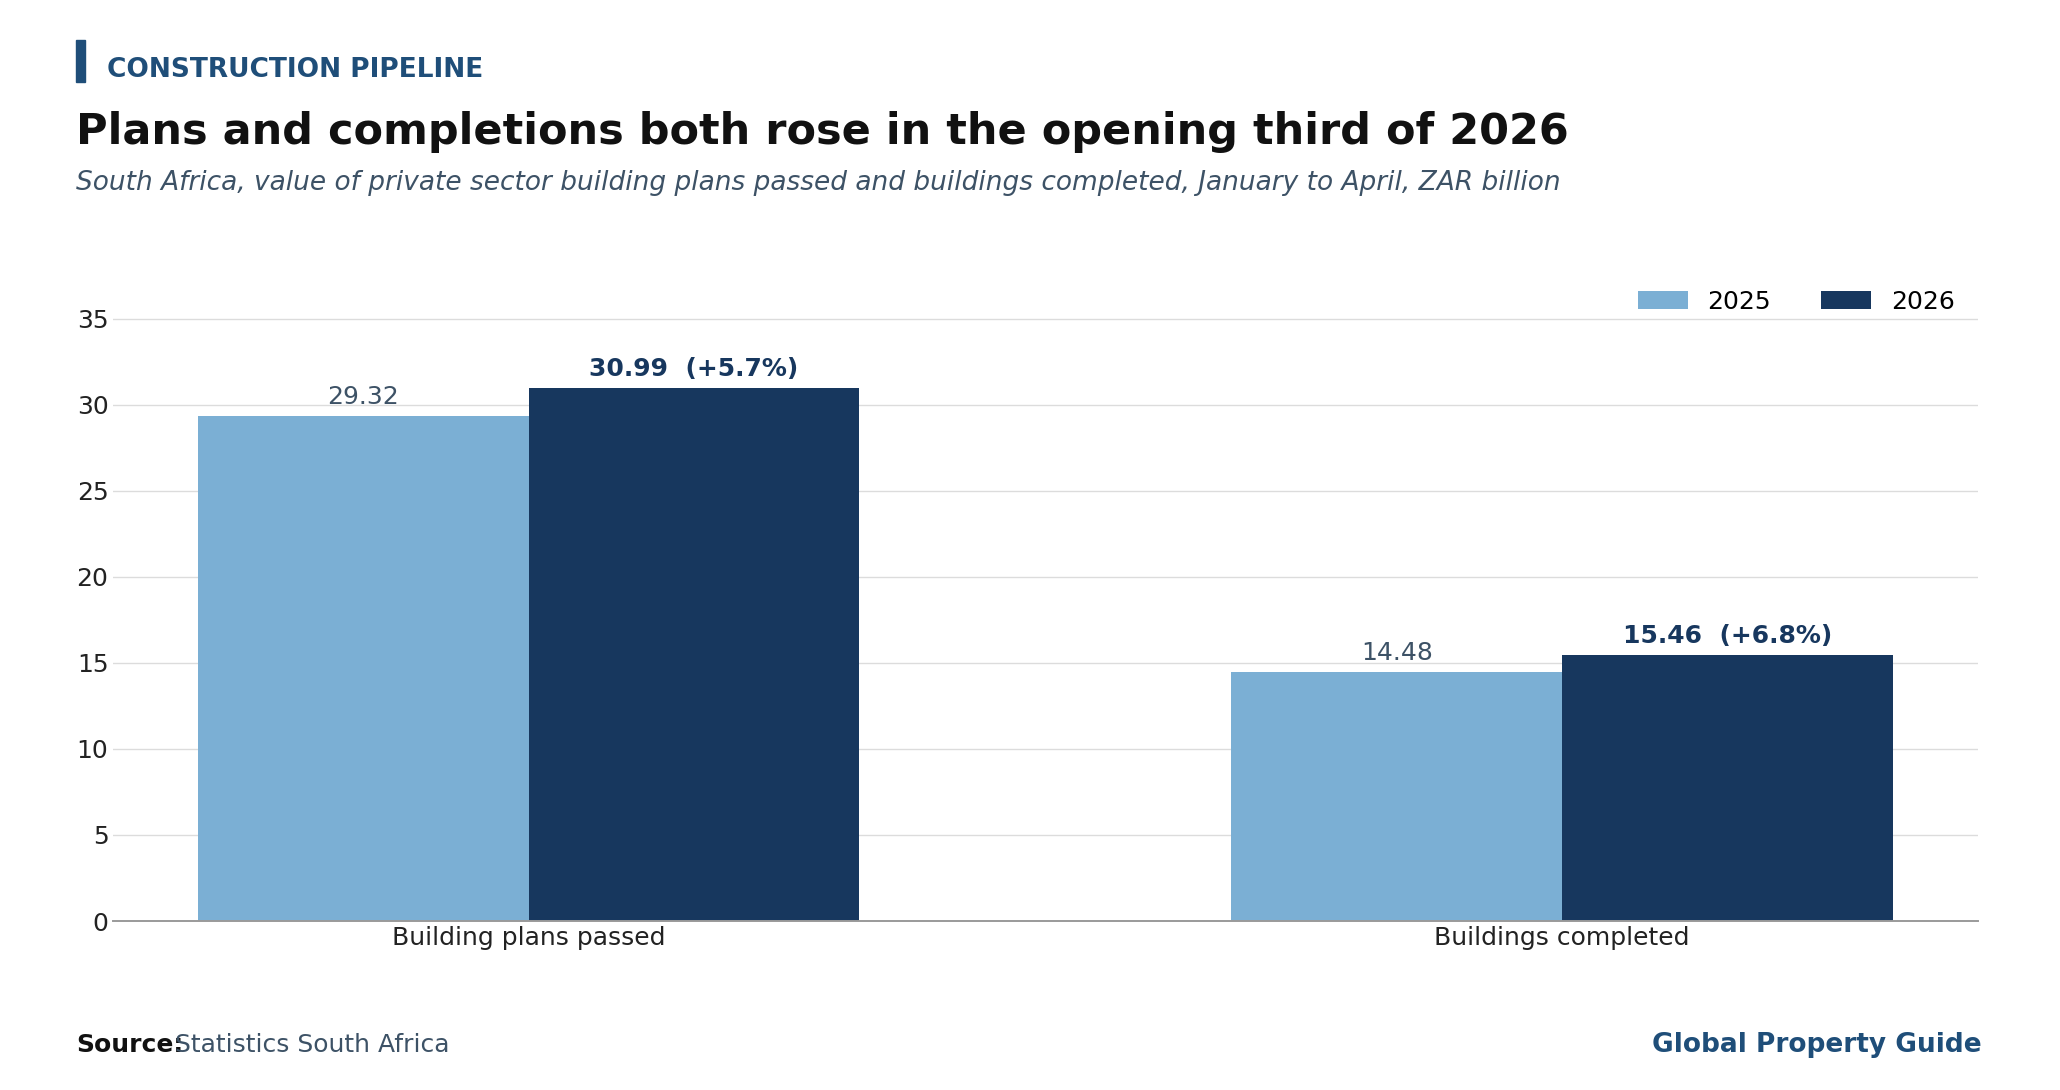
Residential construction has begun to stir, though from levels that remain far below what South Africa needs. The value of building plans passed between January and April 2026 rose by 5.7% to ZAR 30.99 billion (US$1.88 billion) compared with the same period a year earlier, with increases reported for both residential and non-residential buildings, according to Statistics South Africa. KwaZulu-Natal, the Western Cape, and Limpopo were the largest positive contributors, while Mpumalanga was the biggest drag.
The value of buildings reported as completed increased by 6.8% to ZAR 15.46 billion (US$937 million) over the same four months. Six of the nine provinces reported year-on-year increases, led by the Western Cape, Gauteng, and Mpumalanga, with KwaZulu-Natal and North West the main negative contributors. Between February and April, the total value of completions rose 3% against the previous quarter, driven primarily by the residential category, which grew 7.1%.
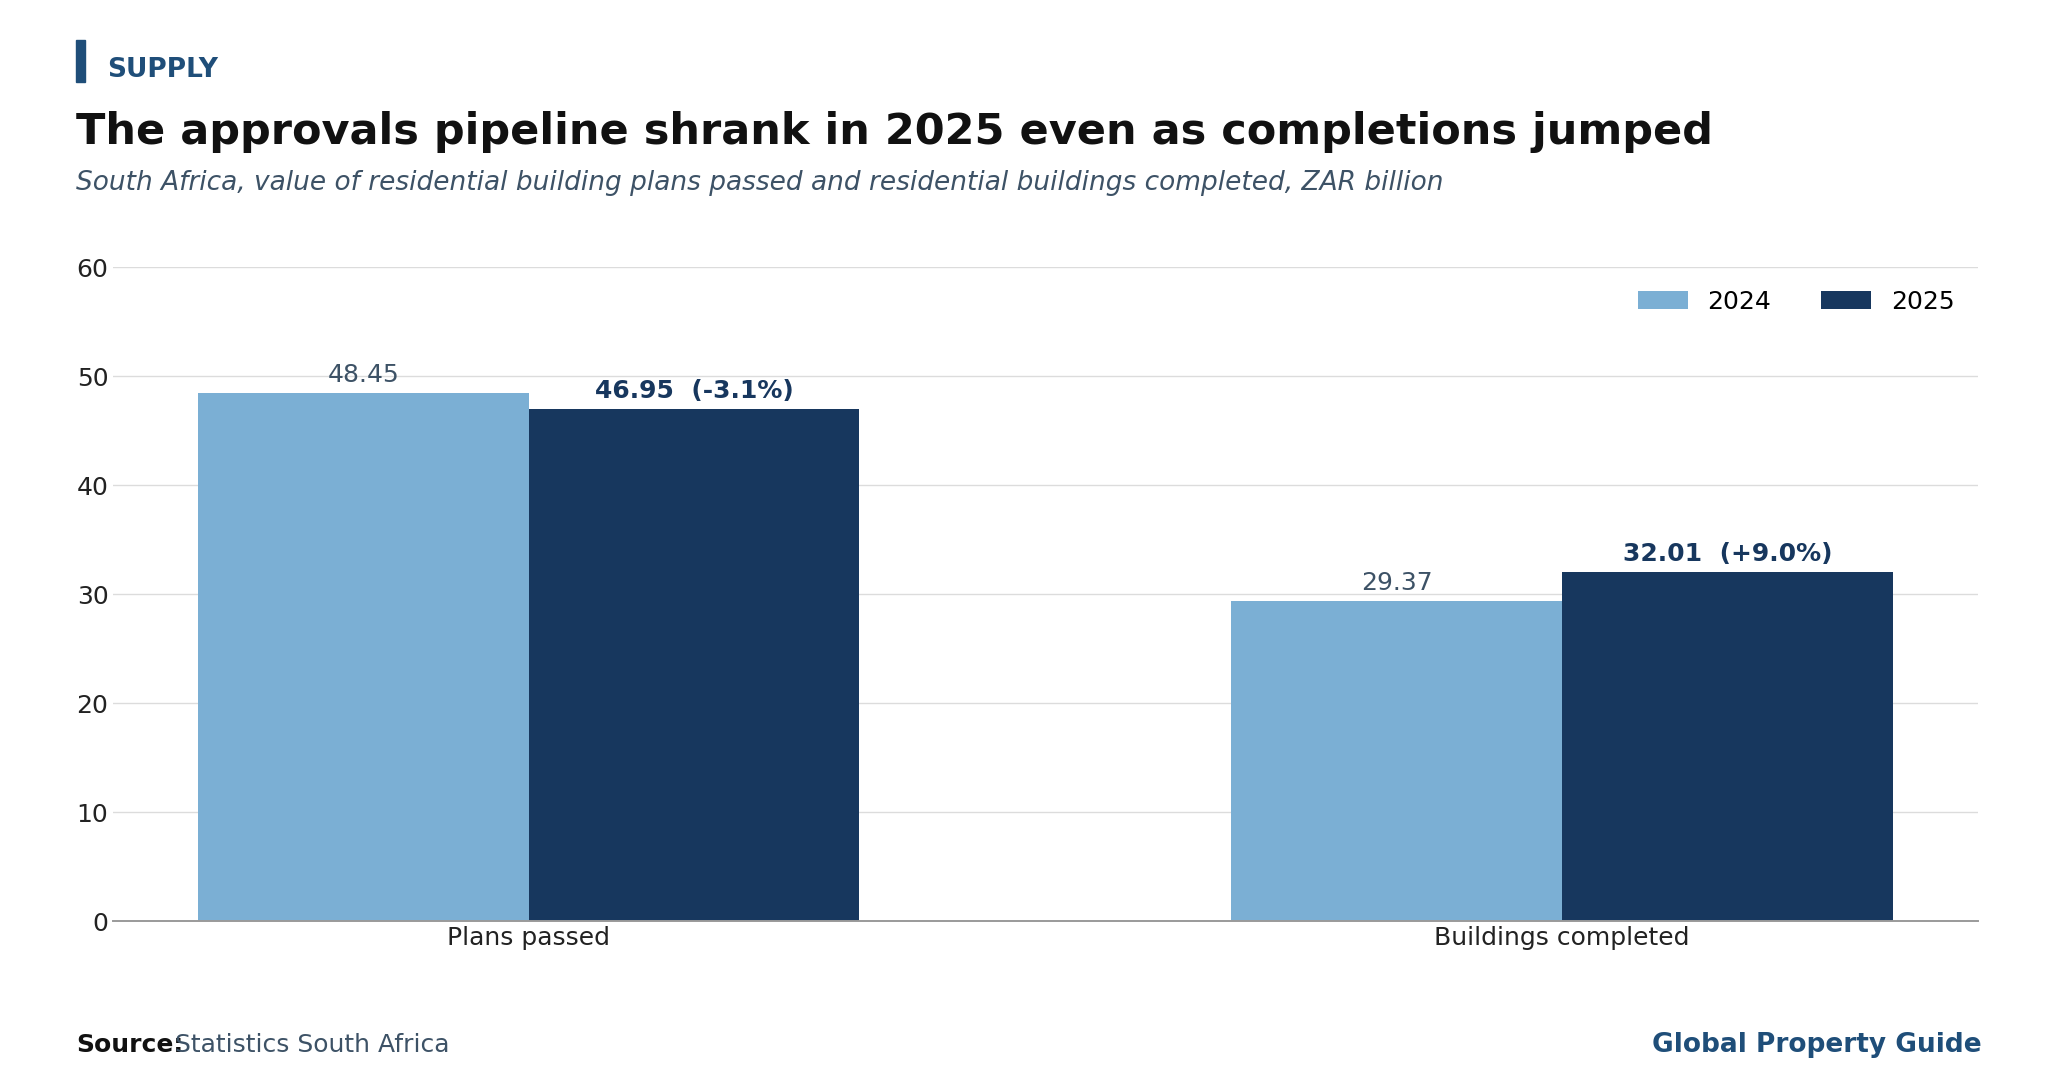
The annual picture for 2025 explains why the base is so low. The value of residential building plans passed fell by 3.1% to ZAR 46.95 billion (US$2.85 billion), and by 5.3% once adjusted to constant 2019 prices, based on figures from Stats SA. Completions ran in the opposite direction, with the value of residential buildings completed rising 9% to ZAR 32.01 billion (US$1.94 billion). Builders were finishing what was already in the ground rather than starting anything new.
That divergence has continued into 2026. In January, the value of residential plans passed fell 1.1% year on year at current prices and 4.4% in real terms. Plans for dwelling-houses dropped 15.8% and for flats and townhouses 9.6%. On the completions side, flats and townhouses fell 36% by value.
Sentiment among builders has deteriorated in step with the oil shock. The FNB/BER building confidence index fell four points to 38 in the second quarter, with more than 60% of respondents dissatisfied with prevailing business conditions. Respondents reported a notable increase in the lack of new demand as a business constraint, suggesting growing pressure on order books.
Mkhwanazi said the sector's recovery had been interrupted by geopolitical uncertainty. He observed that work in the non-residential building sector had gained momentum since 2024 despite starting from a low base, but that higher input costs and greater uncertainty linked to the war in the Middle East had led to project postponements, and that projects still proceeding are significantly less profitable than they would otherwise have been.
FNB's own estate agent survey put residential pipeline activity down 2.6% quarter on quarter. Its February outlook had already flagged construction material costs sitting more than 50 index points above pre-pandemic levels, and noted that residential building activity remains well below the levels seen during the pre-crisis boom of the early 2000s.
For buyers, this constraint is a double-edged thing. It is the main reason FNB does not expect a broad-based price decline even as demand softens. It is also the reason South Africa's structural housing shortage keeps widening.
Rental Market: Rents and Rental Yields
Rental yields are spectacularly high and still climbing
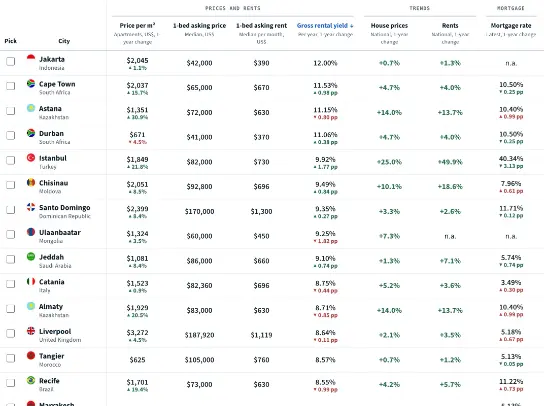
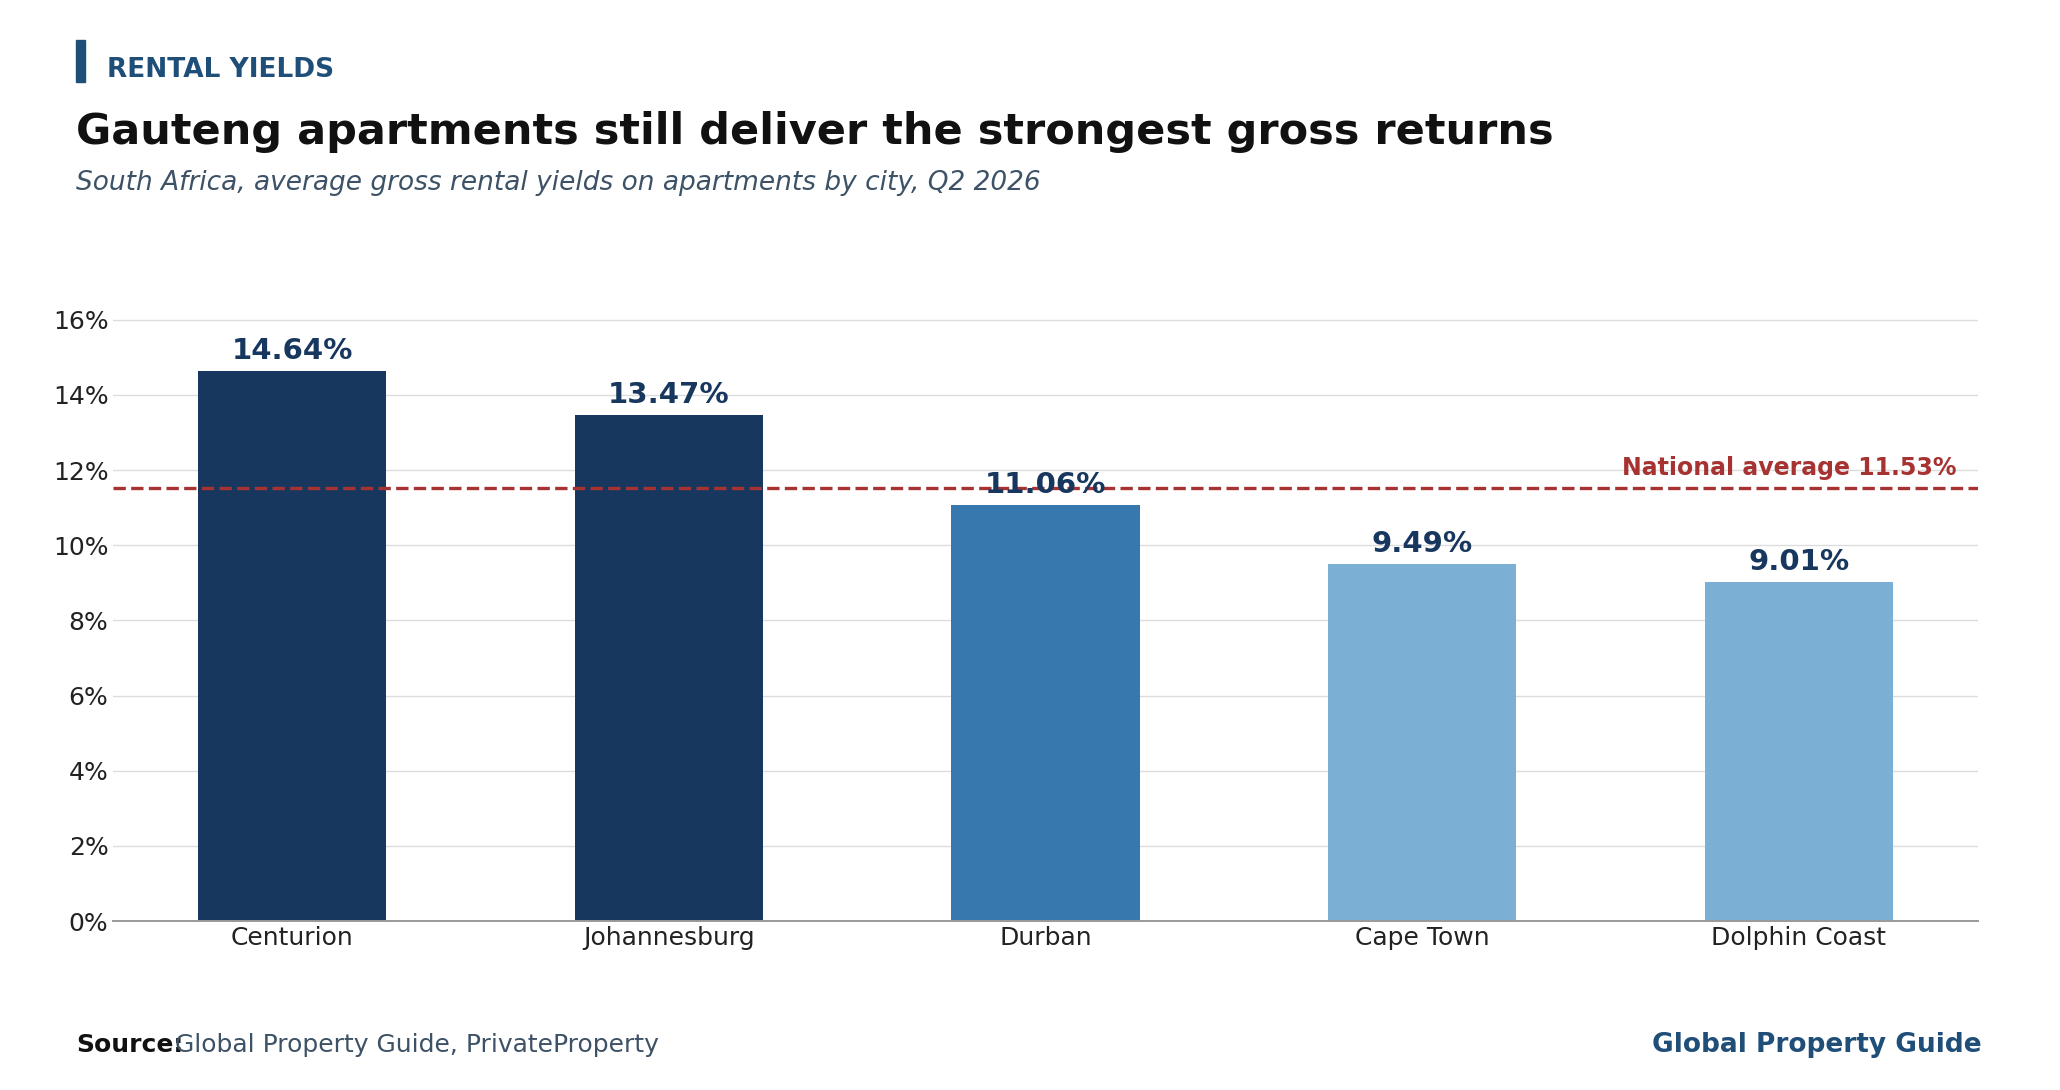
From one perspective, South African landlords have rarely had it better. The gross rental yields for apartments in South Africa, meaning the gross rental return on a property if fully rented out, averaged 11.53% in the second quarter of 2026, up from 10.93% in Q4 2025, 10.36% in Q2 2025, and 9.96% in Q4 2024, according to research conducted by the Global Property Guide. The most recent round of research involved a change of data source, so the latest reading is not strictly comparable with earlier periods.
South Africa's rent price index:
In Johannesburg, apartments offer rental returns ranging from 8.61% to as high as 17.28%, with a city average of 13.47%. Sandton three-bedroom units are the standout at 17.28%, while Bedfordview studios and one-bedroom apartments return 16.90%. The most desirable neighbourhoods in Johannesburg are in the north of the city, including suburbs such as Dunkeld, Hyde Park, Houghton, Illovo, Inanda, Melrose, Parkhurst, Parktown, Parkview, Sandhurst, Saxonwold, and Westcliff. Nelson Mandela had a house in Houghton.
In Cape Town, gross rental yields on apartments are considerably lower, ranging from 4.06% to 14.62%, with a city average of 9.49%. The spread within the city is the widest in the country. Milnerton studios and one-bedroom units return 14.62%, while three-bedroom apartments on the Atlantic Seaboard return just 4.06%.
Cape Town is the most popular tourist destination in Africa, and its beaches and weather are ideal for retirees and foreign property buyers. Atlantic Seaboard properties are among the most sought-after because of the beaches and cliffs, in upscale neighbourhoods such as Bakoven, Bantry Bay, Camps Bay, Clifton, Fresnaye, Green Point, and Mouille Point. Some houses nestled on cliffs have sweeping views of the Atlantic Ocean. City Bowl, which includes the central business district, is another upscale residential area and one of the most stable residential markets in the city because of its prime central location and vibrant cosmopolitan lifestyle.
In other locations:
- In Centurion, gross rental yields for apartments range from 12.97% to 16.26%, with a city average of 14.64%, the highest of any city surveyed.
- In Durban, gross rental yields for apartments range from 7.37% to 13.06%, with a city average of 11.06%. Pinetown and Amanzimtoti outperform the upmarket Umhlanga node.
- On the Dolphin Coast, apartment rental yields range from 8.16% to 10.30%, with an average of 9.01%.
It is worth being precise about why yields are rising. The denominator matters as much as the numerator. Purchase prices in the high-yield Gauteng nodes have been broadly flat for years, so even moderate rent increases translate into sharp yield gains.
That said, rents themselves are now moving. Rental inflation accelerated to 4.1% in June, and vacancy rates continued trending lower, according to FNB. Statistics South Africa's own quarterly rent measurement puts actual rents up 1.1% on the March quarter and 4.1% over twelve months, with townhouses up 5.4%, flats up 4.6%, and houses up 3.7%.
The Western Cape remains the strongest rental market in the country, supported by continued inward migration among higher-income households and tight supply. Gauteng has been stable, though greater housing supply has kept rental growth more contained, while KwaZulu-Natal has shown improving fundamentals.
FNB believes the rental cycle may be close to its peak. The bank noted that while landlords have regained some pricing power, there appears to be a natural limit to how far rents can rise before affordability becomes a binding constraint, and that rental inflation is therefore likely close to its cyclical peak.
All yields quoted here are gross, before taxes, repair costs, ground rents, agents' fees, and other costs. Net yields are typically 1.5 to 2 percentage points lower.
Mortgage Market and Interest Rates
The easing cycle ended before it finished the job
South Africa's mortgage loan interest rates:
South African borrowers spent eighteen months watching their repayments fall, and then watched the process reverse. The SARB cut its repo rate six consecutive times between September 2024 and November 2025, taking prime from a cycle peak of 11.75% down to 10.25%. It was held in January and March 2026, then raised the repo rate by 25 basis points to 7% in May, citing a deterioration in the inflation outlook. Prime now sits at 10.50%.
The July decision to hold surprised markets, which had largely priced in a further increase after the June inflation print. Governor Lesetja Kganyago noted that the crisis in the Middle East had entered a new and volatile phase, with oil prices having fallen to about 70 dollars a barrel earlier in the month before rebounding to roughly 90 dollars. The rand weakened sharply, and bond yields rose immediately after the announcement.
The SARB now expects inflation to average 4.4% in 2026 and 3.7% in 2027 before returning to its 3% target in 2028. FNB expects inflationary pressures to peak in early 2027, creating room for the Bank to resume cutting, which should improve affordability and support mortgage demand.
Housing loans grow slowly, and the mortgage market stays small
Mortgage lending has never really recovered its pre-crisis vigour. Total mortgage advances reached about ZAR 1.95 trillion (US$118.2 billion) in November 2025, up 3.8% year on year, according to figures from SARB. The central bank noted in its December 2025 Quarterly Bulletin that growth in residential property mortgages had been more subdued, accelerating only marginally from 2.6% in February 2025 to 3.1% in October, with total mortgage advances remaining within a narrow band between 3.1% and 3.6% over the first ten months of the year despite lower interest rates.
As a percentage of GDP, the mortgage market stood at around 25.5% in 2025, barely changed over the past decade, and still well below the average of 34% recorded between 2009 and 2011. The Centre for Affordable Housing Finance in Africa (CAHF) has long observed that the mortgage market has made no notable expansion over the last ten years, remaining fairly steady at an average of about 122,000 bonds issued a year.
Competition among lenders, however, is intense. Ooba's effective approval rate improved to 84.5% from 82.8% a year earlier, and almost half of applicants initially declined by one bank secured approval from another after resubmission. Loans covering at least 90% of a property's value recorded the strongest growth, with the value of zero-deposit home loans up 14.3% year on year.
Dyer argued that approved bond size growth trending above property price growth signals that banks have continued to support qualifying buyers with more attractive lending terms as property values rise, and that this is particularly encouraging for first-time homebuyers, who are purchasing more expensive homes and receiving larger loans despite being the segment most sensitive to higher borrowing costs.
That competitive dynamic is the mirror image of the affordability squeeze. Banks are willing to lend more against each property precisely because volumes are thin and the underlying collateral is appreciating. It is an expansion of loan-to-value ratios rather than an expansion of the borrower base.
Economic and Social Factors
Household finances remain fragile
Many South African households are still under considerable financial strain. The ratio of household debt to nominal disposable income rose to 62.2% in the first quarter of 2026 from 61.8% in the fourth quarter of 2025, according to the SARB Quarterly Bulletin. Household debt increased at a slower pace during the quarter, and growth in most categories of credit extended to households slowed, but the rise in debt still outpaced the gain in nominal disposable income.
Households' cost of servicing debt relative to disposable income was steady at 8.4% across both quarters. The ratio of net wealth to nominal disposable income slipped to 440% in the first quarter from 446% in the fourth, and with the JSE all-share index down 3.3% in the second quarter, net wealth is likely to have eased further.
The arrears picture is more troubling than the aggregates suggest. The Eighty20 Credit Stress Report for the first quarter found that total outstanding loan balances grew by ZAR 41 billion to ZAR 2.7 trillion (US$163.6 billion), while 41% of credit-active South Africans were in default on at least one loan, defined as three or more months in arrears. The number of defaulters grew by nearly 400,000 people in a single quarter. Overdue balances rose 14% year on year to ZAR 237 billion (US$14.4 billion), equivalent to 8.8% of total outstanding debt.
The labour market gave back a quarter of progress
South Africa's official unemployment rate rose to 32.7% in the first quarter of 2026 from 31.4% in the fourth quarter of 2025, Statistics South Africa reported. The number of unemployed people increased by 301,000 to 8.137 million, while employment fell by 345,000 to 16.754 million. The Q4 2025 reading had been the lowest since Q3 2020, so the reversal wiped out several quarters of hard-won gains.
Job losses were broad-based, with only three of ten sectors recording gains. Community and social services shed 206,000 positions, construction 110,000, and transport 30,000. The labour force participation rate fell to 59%, the lowest since 2022.
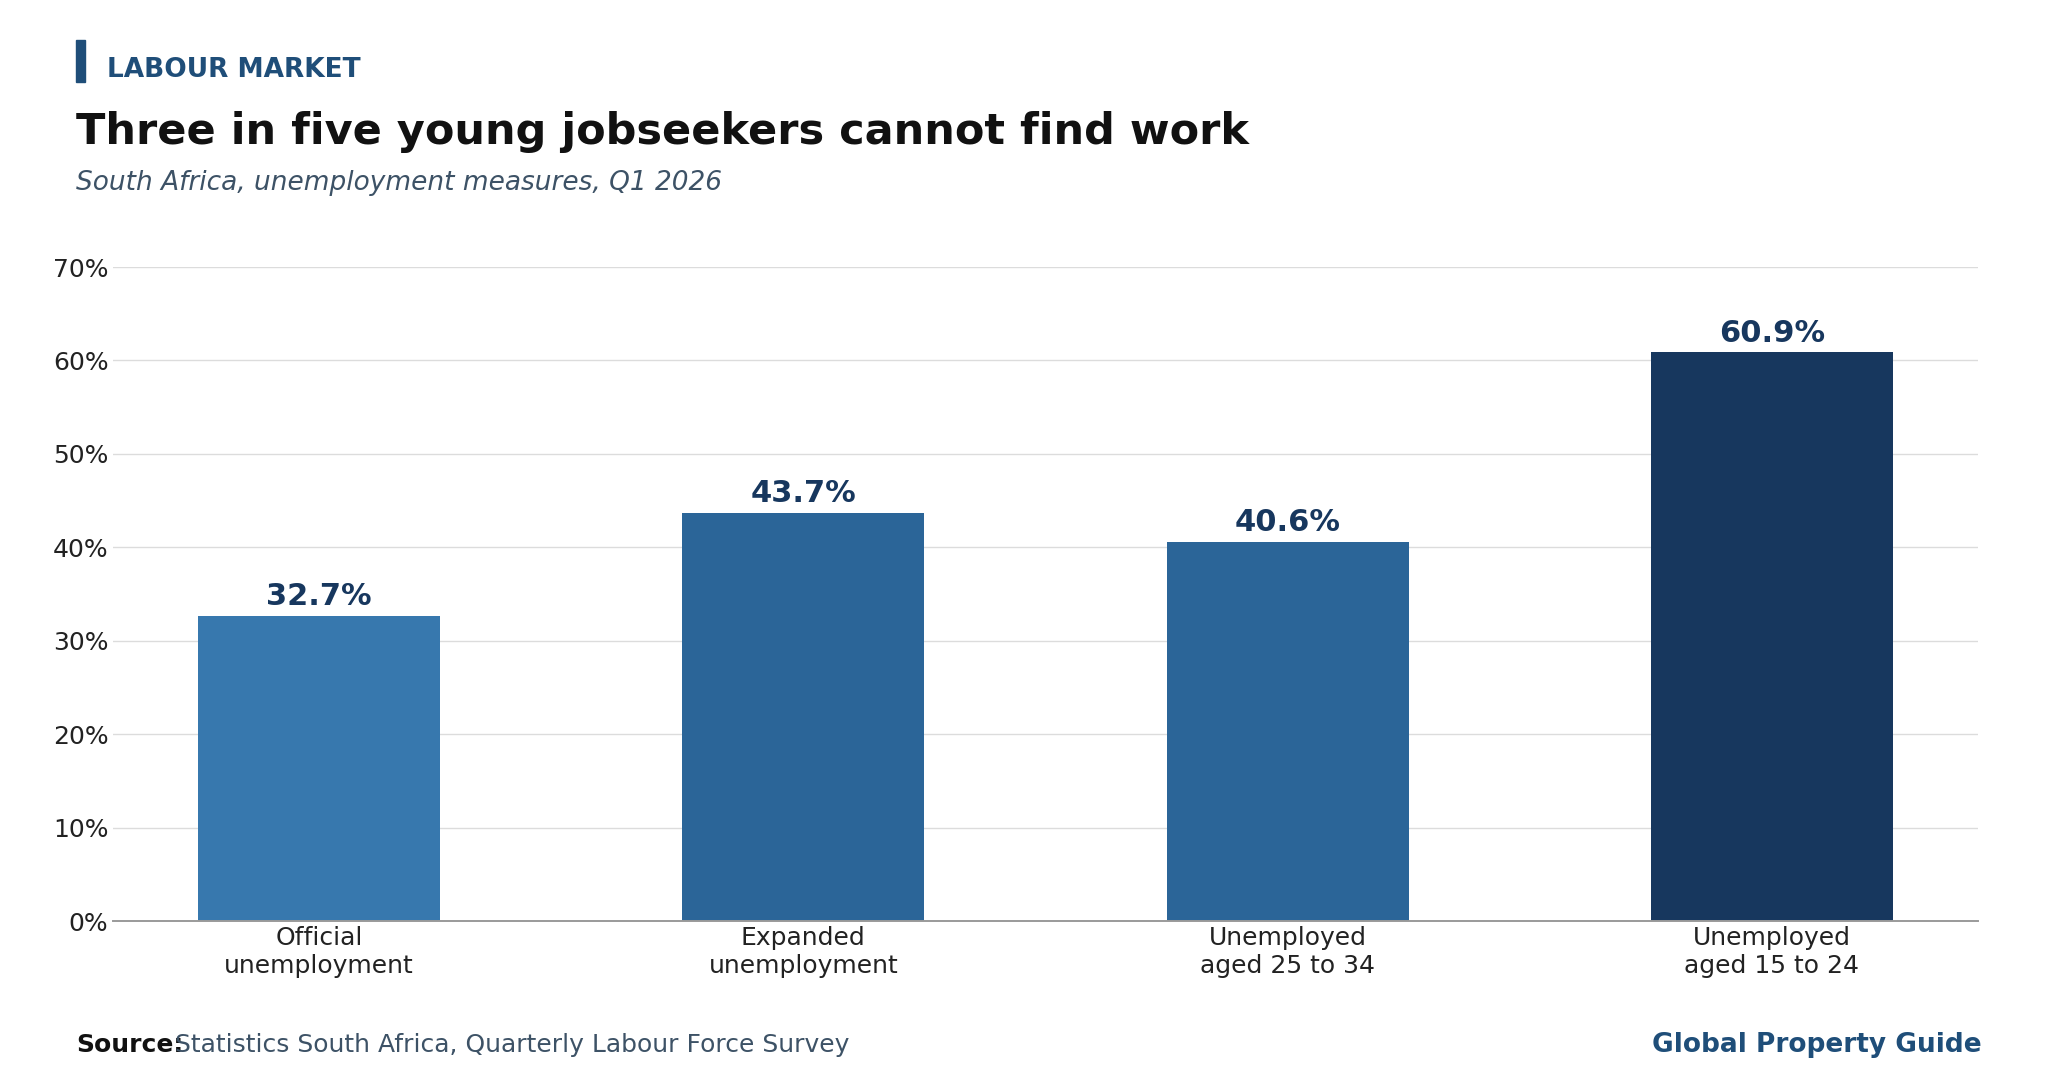
Youth outcomes remain the country's most intractable problem. Among those aged 15 to 24, the unemployment rate reached 60.9%, while for those aged 25 to 34 it stood at 40.6%. Of the 21 million people aged 15 to 34, only 5.6 million were employed. When the expanded definition is used, which includes those discouraged from seeking work, the national jobless rate was 43.7%.
The construction job losses matter directly for housing. A sector already operating below its long-term norms shed more than a hundred thousand positions in three months, which suggests the supply constraint supporting house prices is unlikely to ease soon.
Inflation, growth and the fuel shock
Consumer inflation averaged 3.2% in 2025, the lowest level in over two decades. That achievement was undone within four months. From 3.5% in January and 3% in February, the headline rate climbed to 4% in April, 4.5% in May, and 5% in June.
Transport was the largest contributor to both the annual and monthly changes, driven by fuel prices climbing 34.3% over twelve months, with diesel up 50.8% and petrol up 31.7%. Passenger transport inflation rose 8.1% in a single month, with sharp increases for minibus taxi fares, e-hailing services, and long-distance bus fares. Electricity tariffs rose by almost 10%. Food inflation, at least, continued to ease, slowing to 1.6% in June from 1.9% in May.
The economy underneath is in better shape than it has been for years. GDP grew 1.1% in 2025 and rose 0.5% quarter on quarter in the first quarter of 2026, the sixth consecutive quarter of expansion and the strongest since Q2 2025. Nine of ten industries registered growth, with finance, real estate, and business services the main contributors at 0.9%, followed by agriculture at 3.9%. Manufacturing was the biggest drag, falling 0.8%, and fixed investment declined 1.1%.
Public finances have improved markedly. In the February Budget Review, the National Treasury projected the consolidated budget deficit narrowing from 4.5% of GDP in fiscal 2025/26 to 3.1% by fiscal 2028/29, with gross loan debt stabilising at 78.9% of GDP over the current fiscal year and easing to 76.5% over the medium term, according to analysis by Deloitte.
Two ratings upgrades in seven months
The ratings agencies have noticed. On 5 June 2026, Fitch Ratings raised South Africa's long-term foreign and local currency ratings by one notch to BB from BB-, its first upgrade of the country in almost 21 years, maintaining a stable outlook. Fitch cited South Africa's record of prudent fiscal management and progress on fiscal consolidation, noting that the government debt-to-GDP ratio now sits well below the levels anticipated when the country was downgraded to BB- in 2020. The country has run primary fiscal surpluses averaging around 1% of GDP for four consecutive years.
This followed S&P Global Ratings' one-notch upgrade in November 2025, which lifted the foreign currency rating to BB and the local currency rating to BB+, both with a positive outlook. In May 2026, Moody's revised its outlook to positive from stable while affirming the rating at Ba2, the first positive outlook revision from that agency since 2007.
All three agencies now place South Africa at BB or Ba2, two notches below investment grade, with Moody's and S&P on a positive outlook. Duncan Pieterse, Director-General of the National Treasury, noted that South Africa still has some way to go to regain investment grade, but that for the first time in more than a decade, there is a clear turnaround in the downward ratings trend, and that the turnaround is especially notable given an overwhelmingly negative global sovereign credit trend.
Moody's cautioned that the Middle East conflict poses a near-term risk through higher oil prices, inflation, and pressure on household incomes, and revised down its 2026 and 2027 growth forecasts by roughly 20 to 50 basis points as a result.
Local elections will test the coalition
South Africa will hold its seventh democratic local government elections on Wednesday, 4 November 2026, a date confirmed by President Cyril Ramaphosa in April. The first voter registration weekend took place on 20 and 21 June. The day will be a public holiday.
These polls matter for property in a way national elections often do not, because municipalities determine water, electricity distribution, rates, and the pace at which building plans are approved. Water has emerged as a defining campaign issue, with ageing infrastructure and weak governance in Johannesburg, Durban, and Knysna producing major losses.
The elections will also stress-test the Government of National Unity formed after the 2024 election, when the African National Congress lost its parliamentary majority for the first time in three decades. The coalition has survived a budget crisis, disputes over National Health Insurance, and running battles over expropriation policy, but November will pit its own members against one another ward by ward. Analysts expect further ANC decline, with support potentially dipping toward 30% in Gauteng and KwaZulu-Natal, the provinces containing the most contested metros.
Moody's baseline view is that the Government of National Unity will last through its term to the 2029 national election, supported by the incentives among the main parties to maintain stability and continue reforms, though it warned that reform momentum could be tested by the political cycle.
For the housing market, the reform question is more consequential than the electoral arithmetic. Roughly half the measures under Operation Vulindlela, aimed at the country's energy and freight constraints, are on track. Progress there is what turned 2025 into South Africa's best growth year since 2022. Whether municipal government can be made to function is what will determine whether the construction sector can build its way out of a shortage that has been widening for a decade.
Note on currency conversions: Rand amounts have been converted at approximately ZAR 16.5 to USD 1, the prevailing rate in early August 2026. The rand traded at about 15.8 to the dollar in February, its strongest since June 2020, before weakening through the second quarter on oil price pressure.
Sources:
- Property Barometer and House Price Index (FNB): https://www.fnb.co.za/
- House price growth slows as higher borrowing costs weigh on demand (Business Day / TimesLIVE): https://www.timeslive.co.za/
- P5041.1 Selected building statistics of the private sector (Statistics South Africa): https://www.statssa.gov.za/
- Where South Africa's construction boom is happening (Business Day): https://www.businessday.co.za/
- Gross rental yields in South Africa: Cape Town and 5 other cities (Global Property Guide): https://www.globalpropertyguide.com/
- Banks keep lending as first-time buyers secure pricier homes (Business Day): https://www.businessday.co.za/
- How foreign buyers snapped up R153bn in Cape Town luxury homes in ten years (Business Day, citing Lightstone): https://www.businessday.co.za/
- Statement of the Monetary Policy Committee July 2026 (South African Reserve Bank): https://resbank.co.za/
- SARB keeps interest rates unchanged, surprising markets and analysts (Eyewitness News): https://www.ewn.co.za/
- Prime interest rate history (SA Calc, citing SARB): https://sacalc.co.za/
- Mortgage advances and selected statistics (South African Reserve Bank): https://www.resbank.co.za/
- South African household finances (SARB Quarterly Bulletin, via The South African): https://www.thesouthafrican.com/
- Credit Stress Report Q1 2026 (Eighty20 and XDS): https://www.eighty20.co.za/
- Inflation rises to a two-year high (Statistics South Africa): https://www.statssa.gov.za/
- GDP expands by 0,5% (Statistics South Africa): https://www.statssa.gov.za/
- GDP extends its gains in the fourth quarter (Statistics South Africa): https://www.statssa.gov.za/
- Quarterly Labour Force Survey Q1:2026 (Statistics South Africa): https://www.statssa.gov.za/
- South Africa's Youth and the Labour Market in Q1 2026 (Statistics South Africa): https://www.statssa.gov.za/
- Government welcomes Fitch Ratings upgrade (South African Government): https://www.gov.za/
- Moody's gives SA a ratings tailwind (Daily Maverick): https://www.dailymaverick.co.za/
- President sets 4 November 2026 as date for Local Government Elections (SAnews): https://www.sanews.gov.za/
- Africa economic outlook (Deloitte): https://www.deloitte.com/
- South Africa (International Monetary Fund): https://www.imf.org/
- South Africa Housing Market Report (Centre for Affordable Housing Finance in Africa): https://housingfinanceafrica.org/