New Zealand Residential Real Estate Market Analysis 2023
New Zealand’s great house price boom seems to be over, amidst rapidly rising mortgage interest rates coupled with the imposition of stricter lending restrictions. In November 2022, the nationwide median house price plunged by 12.4% to NZ$ 810,000 (US$510,557) compared to a year ago, in stark contrast to the whopping 23.8% y-o-y growth in November 2021, according to the Real Estate Institute of New Zealand (REINZ).
New Zealand’s house price annual change
When adjusted for inflation, nationwide house prices declined 17.9% over the same period.
Auckland, which accounts for more than 30% of total property sales in New Zealand, saw the biggest y-o-y house price decline of 18.1% during the year to November 2022 – in sharp contrast to the 26.2% house price growth seen in the same period last year.
Huge house price falls were also registered in Wellington, where prices plunged by 17.4% y-o-y in November 2022, followed by Hawke’s Bay (-17.2%), Manawatu/Wanganui (-8.2%), Waikato (-7.4%), and Otago (-6.2%).
Regions with modest to minimal house price declines included Nelson (-4.9%), Bay of Plenty (-3.7%), Gisborne (-3.6%), Canterbury (-3.2%), Northland (-2.7%), Taranaki (-1%), Marlborough (-0.7%), and Tasman (-0.1%).
Only the West Coast and Southland saw y-o-y house price growth of 20% and 10.5%, respectively.
“Rising interest rates, access to finance, and concerns around the economy have created uncertainty in the market. Across Aotearoa New Zealand, market activity through spring has been subdued and median prices continue to soften as buyers remain hesitant,” said Jen Baird, chief executive of REINZ.
Despite the huge house price decline, Auckland remains the most expensive housing market in New Zealand, with an average price of NZ$1,065,000 (US$671,288) in November 2022. It was followed by Tasman, with an average price of NZ$869,500 (US$547,948), Bay of Plenty, with an average price of NZ$857,000 (US$540,189), and Wellington, with an average price of NZ$795,000 (US$501,000).
The cheapest housing can be found on the West Coast and Southland, with average prices of NZ$420,000 (US$264,776) and NZ$475,000 (US$299,449), respectively.
MEDIAN PRICES BY REGION, NOVEMBER 2022 |
|||
| Regions | Median price | y-o-y change (%) | |
| NZD | USD | ||
| NEW ZEALAND | 810,000 | 510,557 | -12.4 |
| Auckland | 1,065,000 | 671,288 | -18.1 |
| Wellington | 795,000 | 501,000 | -17.4 |
| Tasman | 869,500 | 547,948 | -0.1 |
| Bay of Plenty | 857,000 | 540,189 | -3.7 |
| Nelson | 700,000 | 441,228 | -4.9 |
| Waikato | 789,000 | 497,428 | -7.4 |
| Northland | 729,500 | 459,916 | -2.7 |
| Hawke’s Bay | 687,500 | 433,435 | -17.2 |
| Otago | 685,000 | 431,859 | -6.2 |
| Gisborne | 660,000 | 416,107 | -3.6 |
| Marlborough | 700,000 | 441,325 | -0.7 |
| Canterbury | 668,000 | 421,162 | -3.2 |
| Manawatu/Whanganui | 574,000 | 361,897 | -8.2 |
| Taranaki | 620,000 | 390,859 | -1.0 |
| Southland | 475,000 | 299,449 | 10.5 |
| West Coast | 420,000 | 264,776 | 20.0 |
| Source: REINZ | |||
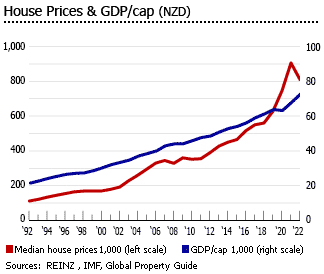
New Zealand saw spectacular house price rises of about 114% (82.5% inflation-adjusted) from 2001 to 2007. Then after a pause, there were nine further years of substantial price rises of about 155% (114.6% inflation-adjusted) from 2012 to 2021, supported by strong demand and economic fundamentals. But house prices have plummeted in recent months, amidst falling property demand.
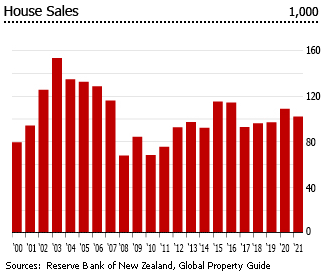
In November 2022, property sales in New Zealand were down by 36.1% to 5,525 units as compared to 8,644 units a year ago, according to REINZ. Sales counts in all regions declined by double-digit figures in November 2022 from a year earlier.
- In Auckland, the number of properties sold was just 1,797 units in November 2022, sharply down by 43.5% from 3,182 units in the same period last year.
- For New Zealand excluding Auckland, property sales fell by 31.7% y-o-y to 3,728 units from 5,462 units a year ago. The regions outside Auckland with the biggest annual decline included Gisborne (-45.2%), Manawatu/Whanganui (-39.1%), and Wellington (-36.2%).
“In late November, the Reserve Bank of New Zealand (RBNZ) raised the OCR by a record 75 basis points to 4.25%. The central bank also forecasts a peak of 5.5% next year and predicts a further rise in inflation. The immediate effect on the real estate market was more hesitancy,” said Baird.
Nationwide, the number of days-on-market increased sharply to 41 days in November 2022 – 12 days more than the same month last year.
Over the same period, the total number of properties available for sale across the country was 28,449, up by 47.7% from a year ago. In fact, two-thirds of all regions saw an annual inventory increase of at least 50%.
The overall economy is showing signs of a slowdown, with a projected economic growth of 2.3% this year, following a 5.6% expansion in the previous year, based on the recent forecast released by the International Monetary Fund (IMF).
A short history of New Zealand’s housing boom
House prices in New Zealand surged by almost 114% (82.5% inflation-adjusted) from 2001 to 2007, including 24.8% in 2003, 12.2% in 2004, 15.3% in 2005, 9.7% in 2006, and 8% in 2007. Big rises - but then, this was a period when the economy expanded by an average of 3.8% every year.
House prices started to fall in early 2008, but the decline was much less than in other countries. After falling by 4.78% in 2008, house prices rose strongly by 9.59% in 2009 – but only to fall again by 2.22% in 2010.
Supported by healthy economic fundamentals, the housing market started to recover in 2011. New Zealand saw another housing boom in the following years, with prices soaring by 155% (114.6% inflation-adjusted) from 2011 to 2021, including double-digit price rises in 2016 (10.97%), 2019 (12.32%), 2020 (18.6%) and 2021 (21.48%).
HOUSE PRICE INDEX, ANNUAL CHANGE (%) |
||
| Year | Nominal | Inflation-adjusted |
| 2008 | -4.78 | -7.89 |
| 2009 | 9.59 | 7.48 |
| 2010 | -2.22 | -6.01 |
| 2011 | 0.85 | -0.98 |
| 2012 | 9.58 | 8.55 |
| 2013 | 9.77 | 8.01 |
| 2014 | 5.39 | 4.59 |
| 2015 | 3.33 | 3.25 |
| 2016 | 10.97 | 9.51 |
| 2017 | 6.59 | 4.92 |
| 2018 | 1.82 | -0.07 |
| 2019 | 12.14 | 10.10 |
| 2020 | 18.63 | 16.95 |
| 2021 | 21.48 | 14.66 |
| Sources: REINZ, RBNZ, Global Property Guide | ||
Housing remains severely unaffordable
New Zealand, particularly Auckland, was rated as “severely unaffordable” with a median multiple of 11.2 in 2022, worse than 10 in 2021 and 8.6 in 2020, according to the 2022 edition of Demographia International Housing Affordability report.
“Auckland has a severely unaffordable median multiple of 11.2. This is up from 8.6 in 2019, an increase of 2.6 times the annual median household income. Auckland ranks 85th in affordability out of 92 markets,” said the Demographia report.
An earlier report by the Economist using its global house price index found that New Zealand house prices were about 40% overvalued relative to income. A report by Oxford Economics released before the pandemic ranked New Zealand as the fifth most at-risk among OECD nations.
Despite a double-digit house price decline this year, residential properties in New Zealand remains significantly overvalued based on historically high price-to-income ratios and mortgage repayment costs, according to a report by Harbour Asset Management. Accordingly, the current median house price remains almost 30% above the pre-pandemic level and is more than 10 times the median household disposable income.
Rental yields are lowish
In Auckland, gross rental yields on apartments are low, with rental yields ranging from 2.43% to 5.72% with a city average of 3.89%, according to Global Property Guide research conducted in December 2022.
Wellington, the capital city of New Zealand, attracts many ex-pats too. This city is prone to earthquakes but most buildings here are earthquake-proofed, especially the new builds. We found that rental yields are best on 2- and 3-bedroom apartments. The city’s average rental yield return is still poor with it being 3.88% and ranging from 3.21% to 4.41%.
Things don’t look better in Dunedin or Christchurch as well, with the former bringing rental yields from 2.30% to 4.32% and the latter from 2.30% to 3.65%.
The rental market is a big deal in New Zealand – about 64.5% of New Zealand dwellings were owner-occupied in Q3 2022, while 32% were rented.
New Zealand rents remain at an all-time high
Nationwide, the median rent for private residences stood at NZ$580 (US$365) for the second month in a row in November 2022, up by 4% from a year earlier and matching the all-time high first recorded in April this year, according to Trade Me Property. On the other hand, Statistics New Zealand’s national rental price index rose by a more conservative 1.5% y-o-y in October 2022.
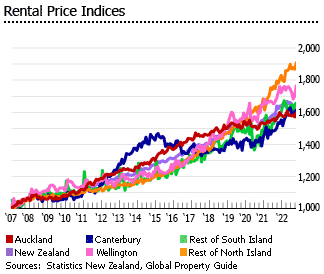
Though there is a wide regional variation, with the major centers actually seeing either no increase or a decline in rents, according to Trade Me Property Sales Director Gavin Lloyd. “However, if we take a closer look at the numbers, there was a lot of variety around the country, with most of the regions seeing rents boom while Auckland and Wellington saw no year-on-year growth.”
By region, in November 2022:
- Nelson/Tasman and Taranaki saw the biggest y-o-y increase of 14%, with their median weekly rents reaching NZ$570 (US$359) and NZ$530 (US$333), respectively.
- Strong annual increases in median rents were also seen in Manawatū/Whanganui (12.5%), Northland (10.1%), Canterbury (9.5%), and Otago (8.3%).
- More modest year-on-year rent increases were recorded in Waikato (6%), Southland (5.3%), Hawkes Bay (3.6%), and Bay of Plenty (3.4%).
- In Auckland, the median weekly rent for private residences was unchanged from a year ago, at NZ$600 (US$377).
- Only Wellington and Marlborough saw year-on-year declines in their median rents. In Wellington, the median weekly rent fell by 3.2% y-o-y to NZ$600 (US$377) while it declined by 7.2% to NZ$450 (US$283) in Marlborough.
The national rental market supply increased by 6% in November 2022 from a year earlier, with the biggest supply increases recorded in Wellington (39%) and Manawatū/Whanganui (38%).
Key rate raised further; mortgage interest rates rising rapidly
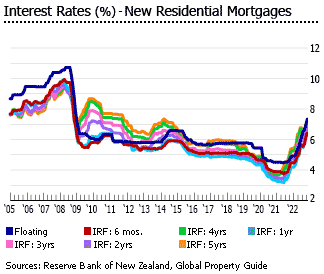
In November 2022, the Reserve Bank of New Zealand (RBNZ) raised its Official Cash Rate (OCR) by 75 basis points to 4.25%, its ninth consecutive rate hike since August 2021 and the biggest single rise since it was established in 1999, as the central bank continues to combat surging inflation. The OCR is now at the highest level since December 2008.
“Committee members agreed that monetary conditions needed to continue to tighten further, so as to be confident there is sufficient restraint on spending to bring inflation back within its 1-3 percent per annum target range,” said the RNBZ.
As a result, residential mortgage interest rates are now rising fast. In November 2022:
- Floating mortgage rate: 7.33%, sharply up from last year’s 4.83%
- 6 months initial rate fixation (IRF): 6.43%, up from the previous year’s 4.45%
- 1 year IRF: 6.46%, up from 4.12% a year earlier
- 2 years IRF: 6.75%, sharply up from 4.65% in the previous year
- 3 years IRF: 6.69%, up from 4.82% a year earlier
- 4 years IRF: 6.9%, up from 5.18% a year earlier
- 5 years IRF: 6.94%, up from 5.36% in the same period last year
New mortgage loans falling sharply
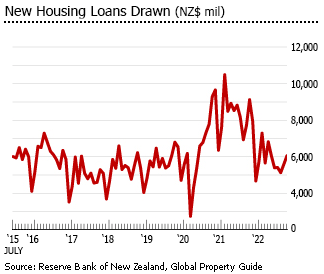
With rapidly rising interest rates and tightening of lending restrictions, it is not surprising that demand for new mortgage loans is now falling sharply. In the first eleven months of 2022, the total value of new residential mortgage loans drawn plummeted by 30% to NZ$63.8 billion (US$40.2 billion) from the same period last year, following annual increases of 29.8% in 2021 and 11.9% in 2020, based on figures from the RBNZ.
Over the same period:
- Loans drawn by owner-occupiers, including first-time homebuyers, (who accounted for about 80% of new residential mortgage loans) fell sharply by 28.4% y-o-y to NZ$ 52.3 billion (US$32.9 billion) in the first eleven months of 2022.
- Loans drawn by investors plunged by 37.4% y-o-y to NZ$10.8 billion (US$6.8 billion).
In Q3 2022, the total value of outstanding residential mortgage loans rose by 5.3% to NZ$ 337.4 billion (US$ 212.7 billion) from a year ago, a slowdown from the y-o-y growth of 11.4% in Q3 2021.
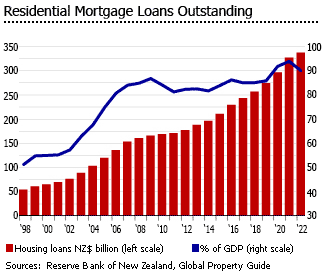
The size of the mortgage market continuously grew from 55.1% of GDP in 2000 to 93.7% of GDP in 2021. Though, it is expected to slow this year due to a sharp decline in new housing loans drawn, amidst rising interest rates.
Loan-to Value Restrictions (LVR) reinstated; lending restrictions tightened further
LVR restrictions, which limit how much banks can lend to low-deposit borrowers, had been in place since October 2013. But in April 2020, the RBNZ temporarily removed LVR restrictions on residential mortgage lending in response to the Covid-19 pandemic. The central bank reinstated them on March 1, 2021.
“LVR restrictions support the stability of the housing market and help reduce the risk of a sharp correction in house prices. They also provide an additional buffer if a housing downturn were to occur, which would particularly affect highly indebted homeowners and investors,” said the RBNZ in its November 2022 Financial Stability Report.
“LVR restrictions, which were reintroduced in early 2021, have helped to limit the number of households in negative equity, which remains small compared to banks’ overall mortgage portfolios. However, further declines in prices would see a marked rise,” the RBNZ noted.
A further tightening of investors’ restrictions took effect in May 2021. Then in November 2021, restrictions on lending to owner-occupiers were also tightened.
Now the RBNZ is also planning to introduce debt serviceability restrictions. “We are also continuing to consider how limits on high debt-to-income (DTI) mortgage lending could operate and are consulting on a regulatory framework with the aim of making final decisions in early 2023,” said the central bank.
Residential construction activity continues to rise
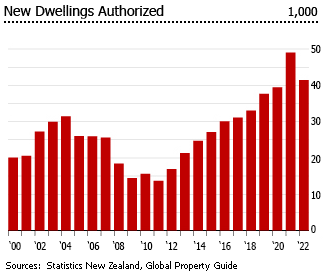
During 2021, the total number of new dwelling consents in New Zealand rose strongly by 24.3% y-o-y to 49,007 units, a sharp acceleration from the annual average growth of about 8.2% in 2015-2020. Then in the first ten months of 2022, new dwelling consents increased further by 3.1% to 41,432 units compared to the same period last year, according to Statistics New Zealand.
By region:
- In Auckland, new dwelling consents were up 8.6% y-o-y to 18,038 units in the first ten months of 2022.
- In Canterbury, consents increased 15.7% y-o-y to 7,408 units.
- In Waikato, consents fell by 7.5% y-o-y to 4,018 units.
- In Wellington, consents rose slightly by 2% y-o-y to 2,868 units.
- In the rest of North Island, consents dropped by 19% y-o-y to 5,355 units.
- In the rest of South Island, consents were up by 10% to 3,744 units in Jan-Oct 2022 from a year earlier.
The value of new dwelling consents in the country also increased 10.1% y-o-y to NZ$16.9 billion (US$10.6 billion) in the first ten months of 2022.
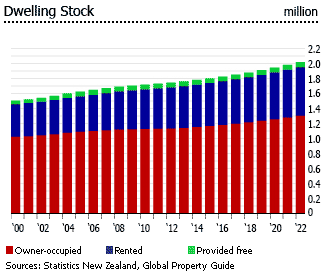
As of Q3 2022, New Zealand’s dwelling stock totaled 2,018,000 units, up by 2.3% from a year ago. Of which, 64.5% were owner-occupied, 32% were rented and the remaining 3.4% were provided free.
Immigration and the housing market
A study by Yale University found that around 40,000 people in New Zealand, or 1% of the population, are living on the streets or in emergency accommodations. This is the highest rate of homelessness in any developed country. It is generally believed that the shortage of housing, the high prices, and the homelessness issue, are all interconnected.
One reason for strong house price rises has been the healthy expansion of New Zealand’s economy.
A second reason was low-interest rates.
A third reason was high immigration.
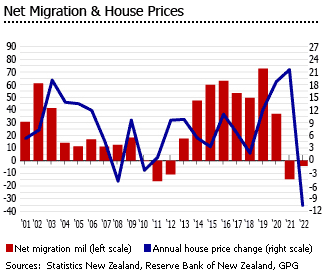
International migrant flows have a significant impact on house price movements and construction activity in New Zealand. From 2005 to 2012, the country’s net migration averaged only 5,350 people every year, because of the weak economy and low employment opportunities. In contrast, net permanent and long-term immigration was more than almost 61,000 people in 2002, 41,500 in 2003 and 14,000 in 2004.
To address the problem, the parliament passed the Overseas Investment Amendment Act, effective in October 2018, prohibiting non-resident foreigners from buying existing homes in the country. There are some exceptions, though. Foreigners with NZ residency status are still allowed to buy houses, as well as people from Australia and Singapore, due to existing free-trade agreements. Foreigners who already own homes in NZ are also not affected by the new law.
“This government believes that New Zealanders should not be outbid by wealthier foreign buyers,” said Environment Minister and former Trade and Economic Development Minister David Parker. “Whether it’s a beautiful lakeside or ocean-front estate or a modest suburban house, this law ensures that the market for our homes is set in New Zealand, not on the international market.”
In the past three years since the law was passed, only about 0.5% of total home transfers in the country were to people without NZ citizenship or resident visas, down from 2.6% in 2018 and 2.4% in 2017. In fact in the year to Q3 2022, the share of non-resident buyers to total sales dropped further to 0.4%, according to Statistics New Zealand.
Before the ban, in central Auckland and the southern scenic hot spot of Queenstown, foreigners accounted for about 22% and 5% of total sales, respectively.
“Is the ban wise or useful? We think it’s neither,” said Dave Platter of Chinese real estate portal Juwai.com. “Foreign buying…tends to be focused on new development, making clear again that foreign investment leads to the creation of new dwellings. That’s vital in a market with a housing shortage, like Auckland.”
In fact, the IMF had previously urged the NZ government to reconsider the ban, as it is unlikely to improve housing affordability in the country. It also warned the move could discourage foreign investment needed to build new homes.
True enough, housing affordability worsened further and house prices continued to surge in the past three years, despite the ban and the Covid-19 pandemic.
During 2020, house prices surged 18.6% from a year earlier, amidst a net migration of 36,844 people. Surprisingly, house prices continued to accelerate last year, rising by a whopping 21.5%, despite a negative net migration of 14,440 due to pandemic-related restrictions. This year, the negative net migration is now gradually reflected in the housing market. In fact, house prices plummeted by 12.4% y-o-y in November 2022, as migrant departures exceed arrivals.
With low population growth and negative net migration, house prices in New Zealand are expected to continuously decline in the medium term.
Modest economic growth; soaring inflation
The NZ economy saw surprisingly strong growth of 6.4% in Q3 2022 from a year earlier, a sharp improvement from minuscule y-o-y growth of 0.3% in Q2 and 0.8% in Q1, according to Statistics New Zealand. The robust growth was mainly driven by the services sector as easing pandemic-induced restrictions boosted both domestic and international demand.
“A fair chunk of this quarter’s whopper growth is an artifact of one-off drivers: the big surge in service activity and exports driven by the opening of the NZ border,” said ASB Bank economist Nat Keall. NZ borders fully reopened on August 1, 2022, driving growth in both domestic and international travel.
On a quarterly basis, the economy expanded by 2% in Q3 2022 – more than double the initial 0.9% growth forecast for the quarter.
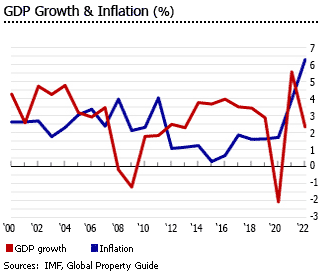
The NZ economy contracted by a modest 2.1% during 2020, mainly due to the negative impact of the Covid-19 pandemic, in contrast to its robust economic performance in the past decade, with growth of 2.9% in 2019, 3.4% in 2018, 3.5% in 2017, 4% in 2016, 3.7% in 2015 and 3.8% in 2014. After the Asian financial crisis, New Zealand grew by an average of 3.8% per year from 1999 to 2007.
The economy expanded strongly by 5.6% last year, as economic activity gradually returns to pre-pandemic levels. NZ’s economic growth is projected at a modest 2.3% this year, as global economic uncertainty remains elevated.
The budget deficit was equivalent to about 1.3% of GDP last year, sharply down from the previous year’s shortfall of about 7.3% of GDP. For the year ending June 2022, the deficit stood at NZ$9.7 billion (US$6.1 billion), which is equivalent to about 2.7% of GDP. It was roughly half of its initial forecast of a NZ$19 billion (US$11.9 billion) shortfall in the Budget 2022.
The deficit is projected to fall to about 0.9% of GDP next year.
New Zealand’s general government gross debt surged to 50.8% of GDP in 2021, sharply up from 43.2% in 2020, 31.8% in 2019, and 28.1% in 2018. It was the highest level seen since 1993. The gross debt is expected to increase further to about 56.6% of GDP this year, according to the IMF.
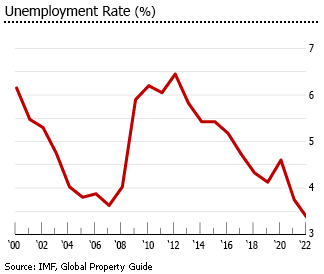
Unemployment stood at 3.3% in Q3 2022, unchanged from a year earlier and the second lowest level ever recorded, according to Statistics New Zealand. There were about 97,000 unemployed people in Q3 2022, slightly down from 98,000 a year ago.
Inflation stood at 7.2% in Q3 2022, slightly down from 7.3% in the previous quarter but still sharply up from 4.9% a year ago. The past two quarters have been the highest levels ever recorded since Q2 1990 and far above the RBNZ’s target range of 1% to 3%.
NZ Prime Minister Jacinda Ardern won a second term in office in a landslide victory during the October 2020 general elections. Ardern vowed to tackle various social issues including housing affordability and homelessness, improved healthcare, and child poverty. She won praise internationally for her handling of two major crises – the 2019 Christchurch mosque shooting, and the 2020 Covid-19 outbreak.
However, there are signs that support for Ardern is gradually waning, amidst surging prices, crime wave, and rapidly rising mortgage interest rates. In fact, recently, the ruling Labour Party lost a seat in a by-election, ahead of nationwide elections next year.
Sources:
- Monthly Property Report November 2022 (Real Estate Institute of New Zealand): https://reinz.co.nz/Media/Default/Monthly%20Press%20Release%20Assets/Residential/11%20-%20November/REINZ%20Monthly%20Property%20Report%20-%20November%202022.pdf
- Rental price indexes: October 2022 (Statistics New Zealand): https://www.stats.govt.nz/information-releases/rental-price-indexes-october-2022/
- Rental Price Index – November 2022 (Trade Me Property): https://www.trademe.co.nz/c/property-industry/news/rental-price-index-november-2022
- International Housing Affordability 2022 Edition (Demograhia): http://demographia.com/dhi.pdf
- Home truths in house prices in 2020 (The Economist): https://worldin.economist.com/article/17515/edition2020home-truths-house-prices-2020
- NZ the ‘second most overvalued housing market in the world (One Roof): https://www.oneroof.co.nz/news/35410
- Harbour Navigator: Despite significant falls, NZ houses are expensive relative to incomes (Harbour Asset Management): https://www.harbourasset.co.nz/research-and-commentary/harbour-navigator-despite-significant-falls-nz-houses-are-expensive-relative-to-incomes/
- Unemployment rate (Statistics New Zealand): https://www.stats.govt.nz/indicators/unemployment-rate/
- Building consents issued: October 2022 (Statistics New Zealand): https://www.stats.govt.nz/information-releases/building-consents-issued-october-2022/
- New residential mortgage standard interest rates (B20) (Reserve Bank of New Zealand): https://www.rbnz.govt.nz/statistics/series/exchange-and-interest-rates/new-residential-mortgage-standard-interest-rates
- Higher interest rates necessary (Reserve Bank of New Zealand): https://www.rbnz.govt.nz/hub/news/2022/11/higher-interest-rates-necessary
- Loan-to-value ratio restrictions (Reserve Bank of New Zealand): https://www.rbnz.govt.nz/regulation-and-supervision/oversight-of-banks/standards-and-requirements-for-banks/macroprudential-policy/loan-to-value-ratio-restrictions
- Financial Stability Report 11/2022 (Reserve Bank of New Zealand): https://www.rbnz.govt.nz/-/media/045e2498a6f8488cb5a99561347e7f42.ashx
- Housing (M10) (Reserve Bank of New Zealand): https://www.rbnz.govt.nz/statistics/series/economic-indicators/housing
- International migration: October 2022 (Statistics New Zealand): https://www.stats.govt.nz/information-releases/international-migration-october-2022/
- Property transfer statistics: September 2022 quarter (Statistics New Zealand): https://www.stats.govt.nz/information-releases/property-transfer-statistics-september-2022-quarter/
- Rental returns are poor in New Zealand: ranging from 2.30% to 5.72% (Global Property Guide): https://www.globalpropertyguide.com/Pacific/New-Zealand/Rental-Yields
- IMF urges New Zealand to reconsider a ban on foreigners’ home ownership (Reuters): https://www.reuters.com/article/us-newzealand-economy-imf-idUSKBN1JU041
- Gross domestic product (GDP) (Statistics New Zealand): https://www.stats.govt.nz/indicators/gross-domestic-product-gdp/
- New Zealand economy grows strongly in Q3, but recession clouds ahead (Reuters): https://www.reuters.com/world/asia-pacific/new-zealand-economy-grows-more-strongly-than-expected-2022-12-14/
- Annual inflation at 7.2 percent (Statistics New Zealand): https://www.stats.govt.nz/news/annual-inflation-at-7-2-percent/
- New Zealand forecasts recession next year but a narrower budget deficit (Reuters): https://www.reuters.com/world/asia-pacific/new-zealand-forecasts-recession-next-year-narrower-budget-deficit-2022-12-14/
- Strong Government books leave New Zealand well placed amid global challenges (New Zealand Government): https://www.beehive.govt.nz/release/strong-government-books-leave-new-zealand-well-placed-amid-global-challenges
- New Zealand (International Monetary Fund): https://www.imf.org/en/Countries/NZL
- New Zealand country profile (BBC News): https://www.bbc.com/news/world-asia-pacific-15357770
- New Zealand election: Jacinda Ardern´s Labour Party scores landslide win (BBC News): https://www.bbc.com/news/world-asia-54519628
- Jacinda Ardern’s 2023 Election Prospects Dim as New Zealand Recession Looms (Bloomberg): https://www.bloomberg.com/news/articles/2022-12-11/new-zealand-s-jacinda-ardern-2023-election-prospects-dim-as-recession-looms?leadSource=uverify%20wall