The U.S. Residential Real Estate Market Analysis 2023
After almost a decade-long house price boom, the U.S. housing market is now losing steam, amidst falling demand and a weakening economy.
The S&P/Case-Shiller seasonally-adjusted national home price index rose by a modest 3.8% y-o-y in January 2023, a sharp slowdown from the prior year’s 19.28% increase and the lowest growth seen since December 2019. When adjusted for inflation, the S&P/Case-Shiller index actually dropped 2.45% over the same period.
This is supported by figures released by the Federal Housing Finance Agency (FHFA), which showed that its seasonally-adjusted purchase-only U.S. house price index increased by 5.27% (and actually dropped 1.07% in real terms) in January 2023 as compared to a year earlier – a sharp deceleration from a y-o-y increase of 18.39% in January 2022.
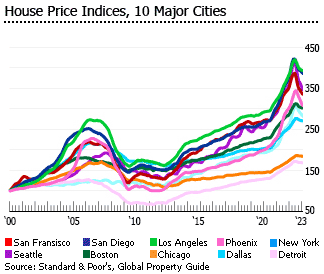
House prices rose in 16 of the country’s 20 major cities, but the rate of growth has considerably decelerated. Miami posted the highest y-o-y increase of 13.84% in January 2023, followed by Tampa (10.52%), Atlanta (8.37%), Charlotte (8.07%), and New York (5.19%). Moderate to minimal house price rises were registered in Dallas (4.95%), Cleveland (4.84%), Chicago (4.82%), Boston (4.25%), Detroit (3.23%), Washington (2.39%), Minneapolis (1.77%), Denver (1.04%), Los Angeles (0.86%), Las Vegas (0.38%), and Phoenix (0.01%).
In contrast, San Francisco saw the biggest annual decline of 7.63% y-o-y in January 2023, followed by Seattle (-5.11%), San Diego (-1.36%), and Portland (-0.52%).
The South Atlantic region had the highest house price increases of 9.56% y-o-y in January 2023, followed by New England (7.06%), East South Central (6.93%), and Middle Atlantic (6.03%), according to FHFA. House prices also increased in West South Central (5.92%), East North Central (5.55%), West North Central (5.34%), and Mountain region (1.4%). Only the Pacific region recorded a house price decline of 1.4% over the same period.
The median sales price of new homes sold rose by 2.5% y-o-y in February 2023, to US$438,200, based on figures from the U.S. Census Bureau. For existing homes, the median price was down slightly by 0.2% from a year earlier, to US$363,000 in February 2023, according to the National Association of Realtors (NAR).
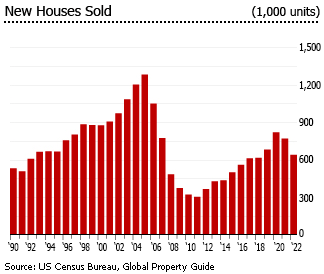
Demand is now falling, amidst rapidly rising interest rates. For the full year of 2022, existing home sales – completed transactions that include single-family homes, townhomes, condominiums, and coops – totaled 5.03 million, down by 17.8% from the previous year, according to NAR. Likewise, sales of new single-family houses fell by 16.4% y-o-y to 644,000 units in 2022, according to the U.S. Census Bureau. Demand for both new and existing homes continues to decline in early-2023.
United States’s house price annual change
“While 2023 kicked off on a more optimistic note for the U.S. housing market, recent mortgage rate volatility highlights how much uncertainty remains. Nevertheless, the continued shortage of for-sale homes is likely to keep price declines modest, which are projected to top out at 3% peak to trough,” said Selma Hepp, the chief economist of CoreLogic.
“Home price depreciation and strong income growth are expected to boost affordability, which is particularly important for first-time buyers. This group has accounted for a higher share of mortgage applications since last summer, as first-time buyers don’t need to surrender an extremely low mortgage rate like current homeowners,” Hepp added.
The U.S. homebuilder sentiment stood at 44 in March 2023, up by 2 points from the previous month but still far below the prior year’s 79, amidst persistently high inflation and rising interest rates, and according to the National Association of Home Builders (NAHB)/Wells Fargo Housing Market Index (HMI). A reading of 50 is the midpoint between positive and negative sentiment. Housing affordability deteriorated sharply last year with mortgage rates reaching their highest level since 2009 and asking prices continuing to rise. The persistent increase in the prices of building materials is aggravating the situation.
The total number of existing homes available for sale stood at 980,000 units in February 2023, unchanged from the previous month but up by 15.3% from a year ago, according to NAR. Existing homes inventory was only at 2.6 months supply in February 2023, up from just 1.7 months in the same period last year.
The overall economy continues to slow. During 2022, the U.S. economy expanded by 2.1% from a year earlier, a slowdown from an annual growth of 5.9% in 2021, primarily driven by increases in consumer spending, exports, private inventory investment, and nonresidential fixed investment, according to figures released by the Bureau of Economic Analysis (BEA).
The world’s biggest economy will slow further in the medium term, with a projected real GDP growth rate of 0.7% in 2023 and 0.9% in 2024, amidst persistent inflation and rising interest rates, based on a forecast released by The Conference Board. This is in line with the World Bank’s 2023 growth forecast for the U.S. economy of just 0.5%.
The U.S. house price cycle
The U.S. experienced a great house price boom from 1996 to early-2006, with major cities such as Los Angeles, San Diego, and San Francisco registering house price surges of 265%, 248%, and 227%, respectively.
Then the housing market began to crash in Q2 2006, amidst rising interest rates. There was a 33.3% fall in the S&P/Case-Shiller composite-20 home price index from Q2 2006 to Q4 2011 during the global financial crisis. Phoenix registered the biggest drop (-54.7%) among the twenty largest metro areas, followed by Miami (-50.5%), Detroit (-43.3%), San Francisco (-40.8%), Los Angeles (-40.1%), and San Diego (-39.7%).
HOUSE PRICE CHANGE (%) |
|||||
| Major Cities | Housing boom (Jan 1996-Mar 2006) | Housing crash (Apr 2006-Dec 2011) | Housing recovery (Jan 2012-Dec 2019) | Covid-19 pandemic (Jan 2020-Dec 2021) | Post-pandemic recovery (2022) |
| New York | 172.58 | -24.45 | 25.57 | 24.95 | 6.51 |
| Los Angeles | 265.48 | -40.06 | 74.25 | 30.89 | 2.73 |
| Chicago | 96.84 | -33.47 | 31.73 | 20.58 | 5.85 |
| Phoenix | 182.59 | -54.73 | 82.21 | 51.06 | 2.90 |
| San Diego | 247.66 | -39.68 | 68.74 | 42.25 | 1.60 |
| Dallas | - | -7.53 | 71.21 | 36.44 | 7.95 |
| San Francisco | 226.59 | -40.82 | 105.19 | 29.44 | -4.13 |
| Detroit | 71.99 | -43.31 | 81.69 | 24.59 | 4.50 |
| Boston | 152.49 | -16.38 | 51.08 | 26.12 | 5.23 |
| Seattle | 134.22 | -23.97 | 95.56 | 39.76 | -1.80 |
| Composite-10 | 192.25 | -33.52 | 55.22 | 28.40 | 4.42 |
| Composite-20 | - | -33.31 | 60.52 | 30.32 | 4.64 |
| Sources: Standard & Poors, Global Property Guide, Federal Reserve Bank of St. Louis | |||||
The U.S. housing market started to recover in the second half of 2012. In 2013, the S&P/Case-Shiller composite-20 home price index soared by 13.5%, then rose by 4.4% in 2014, 5.5% in 2015, 5.4% in 2016, 6.3% in 2017, 4.1% in 2018, and by 2.9% in 2019.
And despite the pandemic, the U.S. housing market surprisingly continued its strong growth, with the S&P/Case-Shiller composite-20 home price index rising by a huge 30.3% from January 2020 to December 2021. Phoenix led the boom, with house prices surging by 51.1% over the period.
U.S. house prices continued to increase in 2022, albeit at a much slower pace, with the S&P/Case-Shiller composite-20 index rising by a modest 4.64%.
Nationwide home sales falling
Existing home sales, which include single-family homes, townhomes, condominiums, and coops, stood at a seasonally adjusted annual rate of 4.58 million units in February 2023, down by 22.6% from 5.92 million units in February 2022, according to NAR.
By region:
- In the Northeast, existing home sales plunged by 25.7% in February 2023 from a year earlier, to an annual rate of 520,000 units.
- In the Midwest, existing home sales fell by 18.7% in February 2023 from a year earlier, to 1.09 million units.
- In the South, existing home sales dropped by a huge 21.3% y-o-y to 2.11 million units in February 2023.
- In the West, existing home sales fell by 28.3% y-o-y to 860,000 units over the same period.
First-time homebuyers accounted for about 27% of total sales in February 2023, down from 31% in the previous month and 29% a year earlier. In addition, all-cash sales were 28% of all transactions in February 2023, down from 29% in the previous month but up from 25% a year ago.
Individual investors or second-home buyers, who account for many cash sales, purchased 18% of homes in February, slightly down from 19% in the previous year, according to NAR.
Residential properties typically stayed on the market for 34 days in February 2023, sharply up from just 18 days in the same month last year.
The primary market follows the same trend. In February 2023, sales of new single-family houses fell by 19% y-o-y to a seasonally-adjusted annual rate of 640,000 units, according to the U.S. Census Bureau.
Foreign buyer interest in the U.S. is falling
Foreign homebuyers purchased 98,600 U.S. properties from April 2021 to March 2022, down by 7.9% from a year earlier, according to NAR’s 2022 Profile of International Transactions in U.S. Residential Real Estate. The total number of homes purchased by foreign buyers accounted for just 1.6% of the total existing homes sold over the period, slightly down from a 1.8% share in the prior period.
The value of existing homes purchased by foreigners during the same period reached US$59 billion, which is equivalent to about 2.6% share of the total dollar volume of existing home sales.
Canadian buyers accounted for 11% of all foreign transactions, followed by Mexicans (8%), Chinese (6%), Indians (5%), Brazilians (3%), and Colombians (3%).
Six states in the U.S. saw the strongest foreign buyer interest – Florida, accounting for a 24% share of all purchases by foreign buyers, California (with 11% share), Texas (8%), Arizona (7%), New York (4%), and North Carolina (4%).
Homebuilder sentiment and construction activity remain weak
The U.S. homebuilder sentiment stood at 44 in March 2023, up by 2 points from the previous month but still far below the prior year’s 79, amidst persistently high inflation and rising interest rates, and according to the National Association of Home Builders (NAHB)/Wells Fargo Housing Market Index (HMI). A reading of 50 is the midpoint between positive and negative sentiment.
With weak homebuilder sentiment, residential construction activity is now falling sharply.
In February 2023:
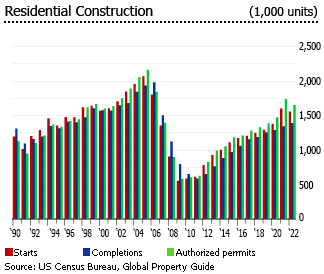
- Housing permits fell by 17.9% y-o-y to a seasonally-adjusted annual rate of 1,524,000 units, based on figures from the US Census Bureau.
- Housing starts dropped 18.4% y-o-y to a seasonally-adjusted annual rate of 1,450,000 units.
- Housing completions rose by 12.8% y-o-y to a seasonally-adjusted annual rate of 1,557,000 units.
During the previous boom, completions peaked at almost 2,000,000 units in 2006 but crashed to 584,900 units in 2011. Completions averaged about 1,300,000 units from 2017 to 2022.
The total inventory of new houses for sale by February 2023 was 436,000 units, which is equivalent to 8.2 months´ supply.
Foreclosure filings rising, but still one of the lowest ever recorded
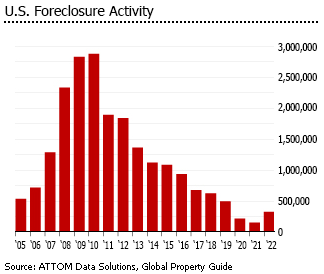
Foreclosure filings, which include default notices, scheduled auctions, and bank repossessions, up by a huge 115% to 324,237 properties in 2022 from a year earlier, according to ATTOM Data Solutions, amidst the end of the government’s foreclosure moratorium, coupled with the increase in mortgage interest rates. Yet it remains down by 34% as compared to 2019 and by 89% from a peak of nearly 2.9 million in 2010.
California saw the highest number of foreclosure starts last year, with 27,269 properties, followed by Texas (23,151 properties), Florida (22,968 properties), Illinois (16,941 properties), and Ohio (13,469 properties).
“Eighteen months after the end of the government’s foreclosure moratorium, and with less than five percent of the 8.4 million borrowers who entered the CARES Act forbearance program remaining, foreclosure activity remains significantly lower than it was prior to the COVID-19 pandemic,” said Rick Sharga of ATTOM Data Solutions. “It seems clear that government and mortgage industry efforts during the pandemic, coupled with a strong economy, have helped prevent millions of unnecessary foreclosures.”
The foreclosure rate was 0.23% of all housing units in the U.S. in 2022, up from 0.11% in 2021 but still down from 0.36% in 2019 and from the peak of 2.23% in 2010.
During 2022, lenders repossessed about 42,854 properties through foreclosures, up by 67% from a year ago but down by 70% from 2019 and by 96% from a peak of 1,050,500 properties in 2010.
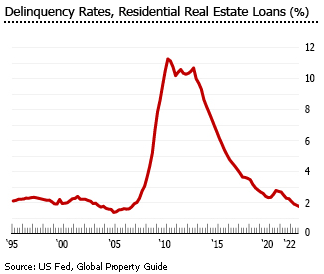
Despite this, the delinquency rate on single-family residential mortgages remained low at 1.77% in Q4 2022, down from 1.85% in the previous quarter and 2.27% a year earlier, according to the U.S. Fed.
Mortgage interest rates rising rapidly
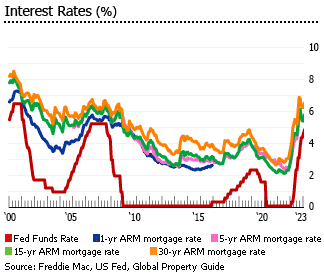
In March 2023, the U.S. Federal Reserve raised its fed funds rate by 25 basis points to 4.75% - 5%, pushing borrowing costs to a new record high since 2007 as inflationary pressures remain elevated. It was its ninth consecutive rate hike in the past twelve months. Partly as a result of the Fed’s monetary tightening, nationwide inflation eased to 6% in February 2023, the lowest level since September 2021 but still three times above the Fed’s target of 2%. Inflation averaged 1.7% annually from 2010 to 2020, before rising to 4.7% in 2021 and above 8% in 2022.
“[T]he Committee decided to raise the target range for the federal funds rate to 4-3/4 to 5 percent,” noted the Fed’s press release for the recent monetary decision. “The Committee will closely monitor incoming information and assess the implications for monetary policy. The Committee anticipates that some additional policy firming may be appropriate in order to attain a stance of monetary policy that is sufficiently restrictive to return inflation to 2 percent over time.”
As a result, mortgage interest rates are now rising rapidly.
- The average interest rate for 30-year fixed-rate mortgages (FRMs) was 6.54% in March 2023, up from 4.17% in March 2022 and 3.085 in March 2021.
- The average rate for 15-year FRMs was 5.8% in March 2023, up 3.39% in the previous year and 2.39% two years earlier.
- The average rate for 5-year adjustable rate mortgages (ARMs) increased to 5.71% in October 2022 (latest data available), from 2.54% a year earlier and 2.89% two years ago.
The mortgage market continues to expand
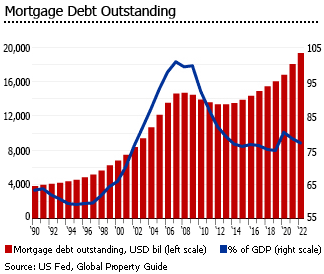
Despite rising interest rates, the mortgage market is still growing. During 2022, mortgage debt outstanding rose by 7.04% y-o-y to US$19.33 trillion, following annual growth of 7.58% in 2021, 4.71% in 2020, 3.69% in 2019, and 3.8% in 2018, according to the U.S. Federal Reserve System.
By property type:
- One- to four-family residences: up 6.6% from a year ago to US$13.37 trillion in 2022
- Multifamily residences: up 8.6% from the previous year to US$2.05 trillion in 2022
- Nonfarm, nonresidential: up 7.9% y-o-y to U$3.31 trillion
- Farm: up 7.6% y-o-y to US$324.3 billion in 2022
One- to four-family residences accounted for almost 70% of the total amount of mortgage loans outstanding.
However, the size of the mortgage market was equivalent to about 77.2% of GDP in 2022, down from 78.5% of GDP in 2021 and 80.4% of GDP in 2020. In fact, it was far lower than 101% of GDP in 2007, based on Global Property Guide estimates.
Rents continue to rise, vacancy rate falling
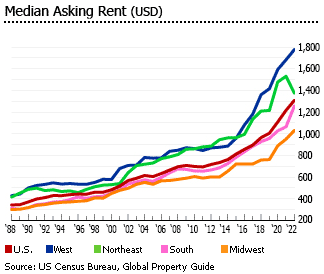
The median asking rent in the U.S. rose by 7.5% y-o-y to US$1,307 per month in 2022, following annual increases of 9.7% in 2021, 10.2% in 2020, 4.3% in 2019, and 7.6% in 2018, according to the U.S. Census Bureau. It was the highest level ever recorded.
By region:
- In the Northeast, the median asking rent fell by 10.1% in 2022 from a year earlier, to US$1,375 per month.
- In the Midwest, the median asking rent increased 8.4% y-o-y to US$1,030 per month in 2022.
- In the South, the median asking rent surged by 18% y-o-y to US$1,255 per month in 2022.
- In the West, the median asking rent rose by 5.6% to US$1,776 per month in 2022 from a year earlier.
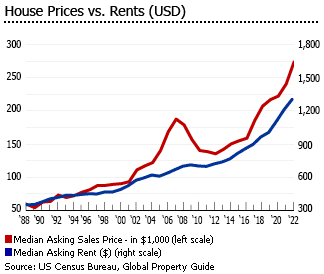
Median rents were more or less static from 2008 to 2014, rising by just about 2% annually, according to the U.S. Census Bureau. However, since 2015, rents have risen at least as fast as house prices. From 2015 to 2022, rents have increased by an annual average growth of 7%. On the other hand, the median asking house price has been rising by about 7.9% annually over the same period.
With rental demand rising again, the nationwide rental vacancy rate dropped to 5.8% during 2022, down from 6.1% in 2021 and the lowest level seen since 1997, according to figures from the U.S. Census Bureau.
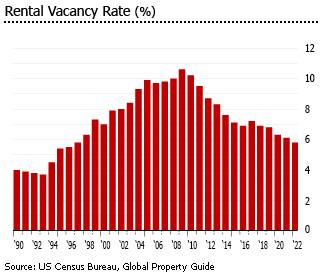
The Northeast had the lowest rental vacancy rate of 3.9% in Q4 2022, followed by the West (4.2%), and Midwest (6.9%). The South had the highest rental vacancy rate of 7.3%.
Homeownership rate gradually rising again
The homeownership rate in the U.S. stood at 65.9% in Q4 2022, slightly up from 65.5% in the previous year and 65.8% two years ago, according to the U.S. Census Bureau. Though it remains lower than the peak of 69% registered in 2004.
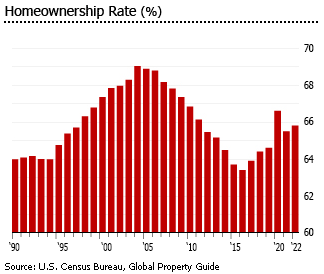
By region:
- In the Midwest, the homeownership rate was 70.1% in Q4 2022, unchanged from the previous year but slightly lower than the 70.8% seen two years ago.
- In the South, the homeownership rate stood at 66.7% in Q4 2022, down from 67.3% in Q4 2021 and 67.7% in Q4 2020.
- In the Northeast, the homeownership rate was 63% in Q4 2022, up from 62.4% in the previous year and 62.6% two years ago.
- In the West, the homeownership rate was 62.6% in Q4 2022, up from 60.5% in the previous year and 60.4% two years earlier.
The TCJA had little impact on the housing market
Former U.S. President Donald Trump signed a landmark tax law (known as the Tax Cuts and Jobs Act or TCJA), the largest overhaul of the U.S. tax code in over 30 years, effective January 1, 2018. The law included a massive reduction of the corporate tax rate from 35% to 21%. But it also reduced the mortgage interest deduction cap, and increased standard deductions, but restricted state and local tax deductions.
Four years after, it seems that increased disposable income is outweighing the loss of tax benefits. Based on a recent study conducted by the Tax Policy Center, about 65% of U.S. households got a tax cut while only 6% paid more.
- Mortgage interest deduction cap decreases. The new law caps the deduction threshold, which helps homeowners lower their taxable income, on new homes at the first US$750,000 of a loan from the original US$1 million.
- Standard deduction increases. The new law raises the standard deduction for all taxpayers to US$12,000 for single filers and US$24,000 for joint filers. This implies that it may no longer be better for some households to itemize the mortgage interest deduction since it would be lower than their standard deduction.
- The state and local tax (SALT) deduction is restricted. The new law caps the SALT deduction at US$10,000 of property value, individual income, and sales taxes. This has the greatest impact on high-income households since about 93% of households earning US$200,000 to US$300,000 annually claim the SALT deduction, compared with only 39% of households earning US$50,000 to US$75,000.
Higher-income households reap the biggest benefits from the new law since their tax rates were significantly reduced. Based on income bracket:
| Household Income | % of Households Who Got a Tax Cut |
| Under US$30,000 | 32.1% |
| US$30,000 – US$50,000 | 69.1% |
| US$50,000 – US$75,000 | 81.7% |
| US$75,000 – US$100,000 | 86.6% |
| Over US$100,000 | 89.5% |
| Sources: Tax Policy Center, MarketWatch | |
TCJA’s US$10,000 limitation on deductions for state and local taxes appears to have accelerated relocations from high-tax states like California, New York, Illinois, and New Jersey to low-tax and no-tax states such as Colorado, Idaho, Florida, Utah, and Nevada.
But in terms of house prices and the size of new mortgages, a new study conducted by the Tax Policy Center published in March 2022 showed that the TCJA had little to no impact: “In our new report, we provide the first empirical estimates of how the TCJA affected mortgages and house prices. Using data from the American Community Survey, the Home Mortgage Disclosure Act, and Zillow, we analyzed how the size of new mortgages and the prices of newly sold homes changed since the TCJA took effect.”
“We find that the reduction in the subsidy for mortgage interest did, in fact, reduce the size of new mortgages. But we also find that the extra income from the lowered taxes offset that reduction. Combining those two factors, the overall effect was a small increase in the size of mortgages.”
Sharp economic slowdown ahead
During 2022, the U.S. economy expanded by 2.1% from a year earlier, a slowdown from an annual growth of 5.9% in 2021, primarily driven by increases in consumer spending, exports, private inventory investment, and nonresidential fixed investment, according to figures released by the Bureau of Economic Analysis (BEA).
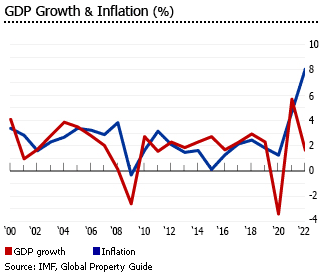
The world’s biggest economy will slow further in the medium term, with a projected real GDP growth rate of 0.7% in 2023 and 0.9% in 2024, amidst persistent inflation and rising interest rates, based on a forecast released by The Conference Board. This is in line with the World Bank’s 2023 growth forecast for the U.S. economy of just 0.5%.
The U.S. economy shrunk by 3.4% during 2020, amidst the Covid-19 pandemic – worse than its 2.6% contraction during the global financial crisis in 2009 and its biggest decline since the demobilization from World War II in 1946.
The federal budget deficit stood at around US$1.3 trillion in 2022, which was equivalent to about 5.2% of GDP last year, according to the Congressional Budget Office (CBO). The shortfall is expected to increase to US$1.4 trillion this year, and further to US$1.7 trillion in 2024 and US$2.7 trillion in 2033.
“The deficit is projected to total $1.4 trillion in 2023; annual deficits average $2.0 trillion over the 2024–2033 period. CBO expects economic growth to stagnate and inflation to slow in 2023 in response to the sharp rise in interest rates during 2022,” said the CBO.
The federal debt reached US$24.26 trillion in 2022 – equivalent to about 97% of GDP last year. It is projected to increase further to about 98% of GDP in 2023 and 100.4% of GDP in 2024.
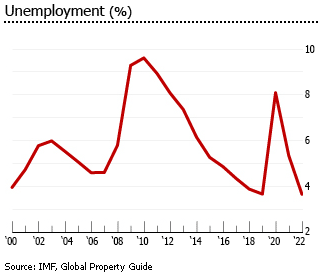
Nationwide inflation eased to 6% in February 2023, the lowest level since September 2021, based on figures from the U.S. Bureau of Labor Statistics. But this is still far higher than the annual average of just 1.7% in 2010-2020 and from the Fed’s target rate of 2%. The unusually high inflation is mainly due to widespread shortages of labor and business supplies.
In February 2023, the unemployment rate was 3.6%, up from a 50-year low of 3.4% seen in the previous month but still one of the lowest ever recorded, according to figures from the U.S. Bureau of Labor Statistics. The country’s jobless rate averaged 6.1% from 2010 to 2022.
Sources:
- House Price Index Datasets (Federal Housing Finance Agency): https://www.fhfa.gov/DataTools/Downloads/Pages/House-Price-Index-Datasets.aspx#mpo
- Monthly New Residential Sales, February 2023 (US Census Bureau): https://www.census.gov/construction/nrs/pdf/newressales.pdf
- Existing-Home Sales Surged 14.5% in February, Ending 12-Month Streak of Declines (National Association of Realtors): https://www.nar.realtor/newsroom/existing-home-sales-surged-14-5-in-february-ending-12-month-streak-of-declines
- 2022 International Transactions in the U.S. Residential Real Estate (National Association of Realtors): https://www.nar.realtor/sites/default/files/documents/2022-international-transactions-in-us-residential-real-estate-07-18-2022.pdf
- Gross Domestic Product (US Bureau of Economic Analysis): https://www.bea.gov/data/gdp/gross-domestic-product
- US Home Price Insights – March 2023 (CoreLogic): https://www.corelogic.com/intelligence/us-home-price-insights-march-2023/
- Monthly New Residential Construction, February 2023 (US Census Bureau): https://www.census.gov/construction/nrc/pdf/newresconst.pdf
- U.S. Foreclosure Activity Doubles Annually But Still Below Pre-Pandemic Levels (Attom Data Solutions): https://www.attomdata.com/news/market-trends/foreclosures/attom-year-end-2022-u-s-foreclosure-market-report/
- Charge-Off and Delinquency Rates on Loans and Leases at Commercial Banks (Board of Governors of the Federal Reserve System): https://www.federalreserve.gov/releases/chargeoff/delallsa.htm
- Effective Federal Funds Rate (Federal Reserve Bank of New York): https://www.newyorkfed.org/markets/reference-rates/effr
- Federal Reserve issues FOMC statement (Board of Governors of the Federal Reserve System): https://www.federalreserve.gov/newsevents/pressreleases/monetary20230322a.htm
- Mortgage interest rates, monthly data: (Freddie Mac): https://www.freddiemac.com/pmms/pmms_archives
- Mortgage Debt Outstanding, Millions of Dollars; End of Period (Federal Reserve Bank of St. Louis): https://fred.stlouisfed.org/release/tables?rid=52&eid=1192326&od=2021-12-01#
- Quarterly Residential Vacancies and Homeownership, Fourth Quarter 2022 (US Census Bureau): https://www.census.gov/housing/hvs/files/currenthvspress.pdf
- Two years after the Tax Cuts and Jobs Act — who are the winners and the losers? (MarketWatch): https://www.marketwatch.com/story/two-years-after-the-tax-cuts-and-jobs-act-who-are-the-winners-and-the-losers-2020-02-11
- Details and Analysis of Canceling the Scheduled Business Tax Increases in Tax Cuts and Jobs Act (Tax Foundation): https://taxfoundation.org/tax-cuts-jobs-act-business-tax-increases/
- How the TCJA Affected the Housing Market (Tax Policy Center): https://www.taxpolicycenter.org/taxvox/how-tcja-affected-housing-market
- New Evidence on The Effect of The TCJA On the Housing Market (Tax Policy Center): https://www.taxpolicycenter.org/publications/new-evidence-effect-tcja-housing-market
- The Budget and Economic Outlook: 2023 to 2033 (Congressional Budget Office): https://www.cbo.gov/system/files/2023-02/58848-Outlook.pdf
- Consumer Price Index Summary (U.S. Bureau of Labor Statistics): https://www.bls.gov/news.release/cpi.nr0.htm
- Labor Force Statistics from the Current Population Survey (U.S. Bureau of Labor Statistics): https://data.bls.gov/timeseries/LNS14000000