Canada's Residential Property Market Analysis 2026
Against the backdrop of weaker economic activity and slower population growth, the Canadian housing market continues to undergo price corrections in sales and rental segments, although regional performance varies, with traditionally more affordable markets proving more resilient.
This extended overview from Global Property Guide covers key aspects of the Canadian housing market and takes a closer look at its most recent developments and long-term trends.
Table of Contents
- Property Prices and Price Index
- Historic Perspective
- Property Demand Trends
- Property Supply Trends
- Rental Market: Rents and Rental Yields
- Mortgage Market and Interest Rates
- Economic and Social Factors
Property Prices and Price Index
Canada’s housing price correction continued in May 2026, although the pace of decline has started to moderate as resale activity showed some improvement from very weak levels. Seasonally adjusted Teranet–National Bank Composite House Price Index, which tracks repeat sales of single-family homes across 11 major metropolitan areas, fell by 1.0% month-on-month in May 2026, marking the sixth consecutive monthly decline. On an annual basis, the index was down 4.3%, its 13th consecutive year-on-year drop.
Year-on-year declines were observed in seven of the eleven cities that make up the index: Hamilton (-9.0%), Toronto (-8.1%), Vancouver (-5.7%), Calgary (-1.7%), Ottawa-Gatineau (-1.7%), Victoria (-0.8%), and Halifax (-0.5%). Conversely, year-on-year price growth was recorded in Quebec City (+10.4%), Winnipeg (+5.9%), Montreal (+2.9%), and Edmonton (+2.9%).
Canada's house price annual change:
National Bank noted that the decline came while resale transaction volumes remained below their historical average, although sales had rebounded over the previous two months. The bank expects prices to gradually stabilize over the coming months, with possible price increases by the end of the year in some markets, supported by improved affordability after significant real price corrections from 2022 peaks. However, fixed mortgage rates, demographic decline, and uncertainty around the renewal of the Canada-United States-Mexico Agreement remain key constraints on the recovery.
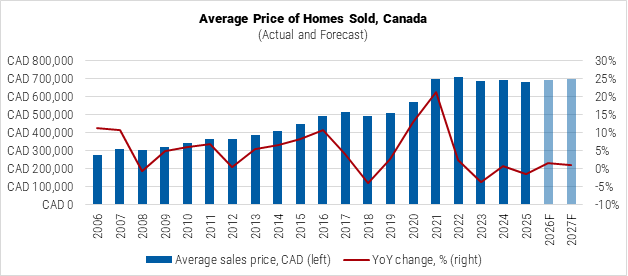
The Canadian Real Estate Association’s (CREA) resale data points to a similar but slightly less negative pricing picture. The National Composite MLS HPI edged down by 0.1% month-on-month in May and remained 4.1% below May 2025, the smallest annual decline so far in 2026. At the same time, the non-seasonally adjusted average price of homes sold increased by 1.5% year-on-year to CAD 702,079 (USD 511,608).
Data Source: CREA.
Regionally, the pricing pattern remained uneven. British Columbia and Ontario continued to be the highest-priced markets and still recorded mild annual price declines, while several lower-priced provinces showed positive annual growth. RBC Economics suggests that affordability remains an important dividing line in Canada’s housing market: price corrections are still more visible in expensive markets where inventory is higher, while comparatively affordable markets are proving more resilient.
Average residential prices by province:
| Average price of homes sold, May 2026, CAD |
Average price of homes sold, May 2026, USD |
YoY, % May 2026 vs May 2025 |
Annual, % change forecast, 2026 |
Annual, % change forecast, 2027 |
|
| British Columbia | CAD 947,859 | USD 690,708 | -1.2% | 0.3% | 0.9% |
| Alberta | CAD 543,602 | USD 396,125 | 3.6% | -0.1% | -0.7% |
| Saskatchewan | CAD 381,100 | USD 277,709 | 3.8% | 3.4% | 0.5% |
| Manitoba | CAD 396,900 | USD 289,222 | 3.9% | 3.5% | 1.6% |
| Ontario | CAD 847,813 | USD 617,804 | -1.5% | 0.1% | 1.2% |
| Quebec | CAD 563,050 | USD 410,297 | 4.0% | 4.1% | 0.9% |
| New Brunswick | CAD 352,200 | USD 256,649 | 10.1% | 2.6% | 1.5% |
| Nova Scotia | CAD 441,400 | USD 321,650 | 0.9% | 1.8% | 0.3% |
| Prince Edward Island | CAD 383,200 | USD 279,239 | 3.0% | 5.3% | 0.1% |
| Newfoundland & Labrador | CAD 349,900 | USD 254,973 | 11.3% | 4.0% | 0.9% |
| Nationwide | CAD 702,079 | USD 511,608 | 1.5% | 1.5% | 0.9% |
| Note: BOC exchange rate as of May 2026, USD 1 = CAD 1.3723. | |||||
| Data Source: CREA. | |||||
Looking ahead, the outlook points to further market stabilization. CREA’s latest quarterly forecast was downgraded, reflecting a weaker-than-expected start to 2026, higher bond yields, and renewed upward pressure on fixed mortgage rates. It now expects the national average resale price to rise by 1.5% in 2026 to CAD 688,955 (USD 502,044), before increasing by only 0.9% to CAD 695,094 (USD 506,518) in 2027. CREA projects little price growth in British Columbia, Alberta, and Ontario in 2026, with gains elsewhere moderating into 2027.
Canada Mortgage and Housing Corporation’s (CMHC) 2026 Housing Market Outlook is broadly aligned with this cautious view. It anticipates national prices to stabilize and rise only modestly over the forecast horizon, with Ontario likely to see further declines in 2026 due to high inventory and muted sales. At the same time, CMHC expects stronger conditions in lower-priced markets to gradually moderate after the gains recorded in 2025.
Historic Perspective
Regional Divergence and the Core Drivers of Canadian Price Movements
Canada’s housing market has moved through several distinct cycles over the past two decades. In the mid-2000s, price growth was supported by strong economic conditions, low unemployment, and favorable borrowing costs. Gains were particularly strong in Alberta, where Calgary and Edmonton recorded annual price increases of 44.50% and 42.35%, respectively, in 2006, supported by the energy-sector boom. Vancouver also posted strong growth, while Toronto’s price increases were more moderate.
The global financial crisis temporarily interrupted this expansion, with the 11-city composite index falling by 1.66% in 2008. However, the correction was relatively short-lived compared to the US, helped by stricter lending standards, a more conservative banking system, and lower exposure to subprime lending. By 2009, prices had rebounded, with the composite index rising by 8.24%.
The early 2010s brought more moderate and regionally uneven growth. Toronto and Vancouver increasingly pulled ahead of other major markets, while Calgary and Edmonton became more exposed to energy-sector volatility. By 2016, affordability pressures had intensified again, with Toronto recording a 21.67% annual increase and Vancouver rising by 16.94%.
Policy tightening followed. Mortgage qualification rules were strengthened, including the broader B-20 stress test for uninsured mortgages adopted in 2018, while British Columbia and Ontario introduced foreign-buyer taxes. These measures helped cool the most expensive markets and contributed to slower national price growth in 2018 and 2019.
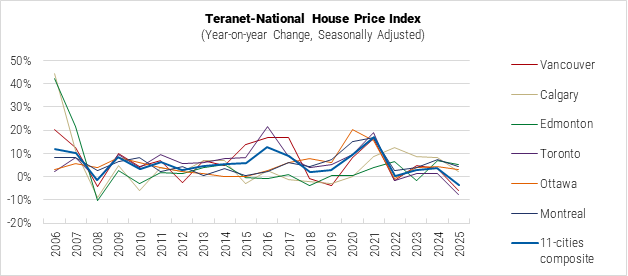
The pandemic then triggered a new upswing. Ultra-low interest rates, remote work, and shifting preferences toward larger homes pushed demand sharply higher. The 11-city composite index rose by 9.36% in 2020 and by 16.91% in 2021, with strong gains across several major markets, including Ottawa, Montreal, Toronto, and Vancouver.
The cycle turned in 2022 as the Bank of Canada raised interest rates aggressively to contain inflation. Price growth slowed sharply, with the composite index rising by only 0.12% that year, while Toronto and Vancouver moved into annual decline. Calgary and Edmonton performed better, supported by more affordable pricing and stronger local economic conditions.
After modest gains in 2023 and 2024, the correction became more visible again in 2025. The 11-city composite index declined by 3.53%, led by renewed weakness in Toronto (-7.84%) and Vancouver (-5.94%). By contrast, Edmonton (+5.15%), Montreal (+4.14%), Ottawa (+3.00%), and Calgary (+2.02%) remained in positive territory. The weaker pricing environment reflected trade uncertainty, slower population growth, softer economic conditions, and subdued buyer sentiment, with the largest corrections concentrated in Ontario and British Columbia.
Note: Year-on-year change as of December.
Data Sources: Teranet and National Bank of Canada.
Property Demand Trends
Resale Activity Remains Subdued Despite Early Signs of Stabilization
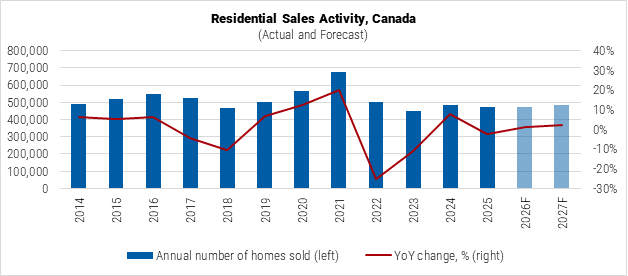
Canada’s residential demand remained subdued in early 2026, with resale activity still below last year’s level despite a modest improvement in May. During the first five months of the year, 180,850 residential properties were sold nationwide, down 5.68% compared to the same period in 2025. The market showed some renewed momentum in May, when national home sales increased by 5.5% month-on-month, although actual activity was still 5.1% lower than in May 2025.
The May rebound suggests that some sidelined buyers are beginning to return as market conditions become more balanced. CREA noted that the improvement was broad-based, although disproportionately driven by Ontario. At the same time, the national sales-to-new-listings ratio tightened to 49.2%, while months of inventory fell to 4.8, close to the long-term average.
Data Source: CREA.
Nevertheless, the recovery remains fragile. Affordability pressures, economic uncertainty, and weaker demographic momentum continue to weigh on demand. The Bank of Canada (BOC) noted that housing activity remains constrained by slow population growth, economic uncertainty, and ongoing affordability challenges. This shift is also visible in population data, with Statistics Canada reporting a 0.1% quarterly decline in Canada’s population in Q1 2026, alongside a continued reduction in the number of non-permanent residents.
CREA’s latest forecast was downgraded following a weaker-than-expected start to the year and renewed uncertainty around mortgage rates. The association noted that the oil-price shock had raised inflation expectations, pushed bond yields higher, and resulted in an increase in fixed mortgage rates, which is expected to delay part of the anticipated recovery in buyer activity. CREA now forecasts 474,972 residential sales through Canadian MLS Systems in 2026, up 1.0% from 2025. The national increase is expected to be driven mainly by British Columbia and Ontario, where sales have more room to recover after a weaker period. In contrast, activity is seen to rise only modestly or decline in provinces where demand had previously been supported by record population growth, which is no longer a major driver.
Seasonally adjusted annual home sales by province:
| Residential Sales, 2025 |
YoY, % | Residential Sales, 2026 (f) |
YoY, % | Residential Sales, 2027 (f) |
YoY, % | |
| British Columbia | 70,207 | -5.7% | 71,868 | 2.4% | 73,727 | 2.6% |
| Alberta | 76,981 | -7.8% | 75,251 | -2.2% | 76,399 | 1.5% |
| Saskatchewan | 16,403 | 0.7% | 16,037 | -2.2% | 16,409 | 2.3% |
| Manitoba | 16,655 | 5.7% | 15,606 | -6.3% | 16,139 | 3.4% |
| Ontario | 162,819 | -5.7% | 167,040 | 2.6% | 171,107 | 2.4% |
| Quebec | 97,089 | 7.7% | 99,382 | 2.4% | 100,746 | 1.4% |
| New Brunswick | 9,644 | 4.1% | 9,804 | 1.7% | 9,977 | 1.8% |
| Nova Scotia | 11,066 | -0.1% | 10,735 | -3.0% | 11,230 | 4.6% |
| Prince Edward Island | 2,146 | 6.0% | 2,166 | 0.9% | 2,209 | 2.0% |
| Newfoundland | 6,138 | 7.9% | 6,183 | 0.7% | 6,227 | 0.7% |
| Nationwide | 470,049 | -2.4% | 474,972 | 1.0% | 485,071 | 2.1% |
| Data Source: CREA. | ||||||
Property Supply Trends
Housing Starts Stay Elevated, While New Construction Momentum Softens
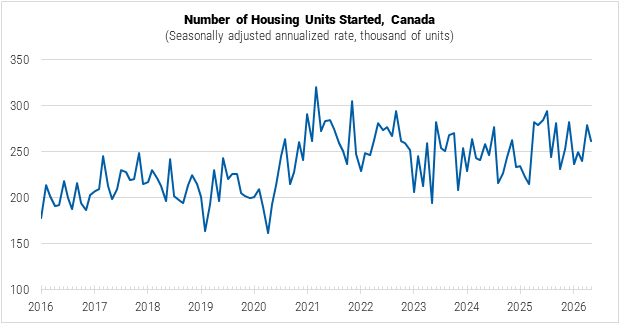
Canada’s residential construction cycle remains active, but the latest housing starts data points to softer and more uneven supply momentum. The market continues to benefit from projects already in the pipeline, while new starts are beginning to weaken as developers adjust to softer demand, elevated inventories, slower population growth, and more cautious pre-construction activity.
According to CMHC data, nationwide housing starts reached a seasonally adjusted annual rate (SAAR) of 261,377 units in May 2026, down 6.22% from the same month a year earlier. The decline was concentrated in several of the largest construction markets. Ontario, Alberta, Quebec, and British Columbia continued to account for the highest volumes of starts, but all recorded year-on-year decreases. Gains in Saskatchewan, Nova Scotia, and Manitoba partly offset this weakness, pointing to a more mixed provincial supply picture.
Data Source: CMHC.
New housing starts by province (seasonally adjusted annualized rate):
| Housing Starts, SAAR, May 2026 |
YoY, % May 2026 vs May 2025 |
|
| British Columbia | 38,219 | -2.03% |
| Alberta | 58,354 | -15.38% |
| Saskatchewan | 8,617 | 51.02% |
| Manitoba | 9,438 | 4.74% |
| Ontario | 69,670 | -3.59% |
| Quebec | 53,991 | -14.84% |
| New Brunswick | 7,197 | -16.25% |
| Nova Scotia | 12,136 | 26.59% |
| Prince Edward Island | 2,428 | 312.22% |
| Newfoundland | 1,327 | -16.17% |
| Nationwide | 261,377 | -6.22% |
| Data Source: CMHC. | ||
The softer near-term trend is consistent with CMHC’s latest assessment of weaker forward momentum. In its May 2026 housing starts release, CMHC noted that approved units not yet started declined, suggesting that fewer projects are moving from approval toward construction. TD Economics reached a similar conclusion, arguing that housing starts are likely to “grind lower” as weaker population growth, elevated unsold inventories, rising rental vacancy rates, and earlier weakness in pre-construction sales weigh on homebuilding.
CMHC’s latest Housing Market Outlook also points to a cooling construction cycle. The agency expects housing starts to remain relatively high in 2026, supported by projects already in the pipeline, before declining in 2027 and 2028 as high development costs, softer demand, elevated inventories, and weak condominium pre-sales weigh on new construction activity.
Despite the weaker near-term outlook, Canada’s longer-term supply challenge remains substantial. CMHC’s latest supply-gap framework estimates that restoring affordability to pre-pandemic levels would require around 430,000–480,000 new housing units annually over the next decade, almost double the current projected pace of construction.
Rental Market: Rents and Rental Yields
Asking Rents Continue to Decline Nationally and in Key Regional Submarkets
Although still outpacing general price growth, rental inflation in Canada, as measured by the annual change in the rents component of the consumer price index (CPI), has moderated substantially over the past two years from a decade-high of 8.9% in August 2024 to 3.5% most recently reported in May 2026.
Canada's rent price index:
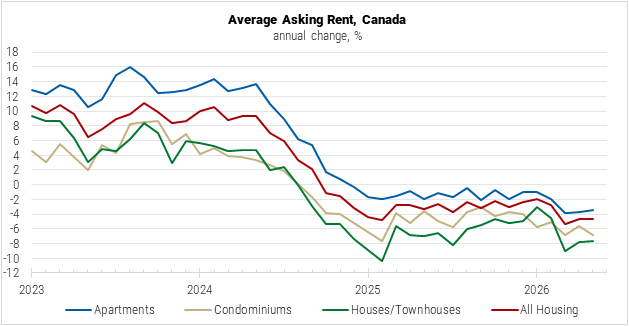
In parallel, asking rents, typically seen as a more immediate indicator of current market conditions, have been in decline nationally in year-on-year terms since October 2024. According to figures from the listing platform Rentals.ca, the average asking rent for all housing types combined decreased by 4.7% in May 2026. This downward trend was observed across all property types, with the most pronounced decreases recorded in the houses and townhouses category (-7.7% year-on-year), followed by condominiums (-6.8% year-on-year), while purpose-built apartment rents dropped by 3.4% year-on-year.
Data Source: Rentals.ca.
Despite the twenty consecutive months of declines, average asking rents across Canada reported by Rentals.ca are still about 22% higher than the pandemic low recorded four years ago in April 2021, reaching CAD 2,031 (USD 1,481) for purpose-built rental apartments, CAD 2,076 (USD 1,513) for condos, and CAD 2,004 (USD 1,461) for houses/townhouses in May 2026. Regionally, the highest average rents for apartments and condos were reported in British Columbia, Ontario, and Nova Scotia, while other provinces remained more affordable, with rents below the national average.
While asking rents continue to fall nationally, the dynamic varies across regional submarkets. Compared to the levels reported during the same period a year ago, Alberta, British Columbia, Ontario, and Quebec showed decreases, while Saskatchewan, Nova Scotia, and Manitoba posted modest growth.
In general, price correction has been more pronounced in traditionally expensive submarkets, while more affordable locations stagnated or trended upwards. The province of Nova Scotia, however, remains an outlier, simultaneously displacing British Columbia as the most expensive apartment and condo market in the country as of May 2026 and showing a 2.6% annual increase in average rents. According to Rentals.ca, this phenomenon can be explained by a high concentration of new and higher-priced supply in the Halifax and Dartmouth region of Nova Scotia, as well as a higher proportion of larger two-bedroom and three-bedroom units listed for rent compared to other traditionally expensive provinces. Nova Scotia also continues to experience net positive interprovincial migration, which supports demand for rental housing.
On the municipal level, all six largest Canadian cities posted annual decreases in asking rents for apartments and condos in May 2026, with the trend most pronounced in Calgary (-5.1%), followed by Vancouver (-4.6%), Edmonton (-4.0%), Ottawa (-3.5%), Toronto (-3.4%), and Montreal (-0,2%).
In terms of gross rental yields for residential units in Canada, research by Global Property Guide found those at an average of 5.72% in February 2026, up from 5.46% previously reported in January 2025. The highest yields among the assessed submarkets were observed in Calgary (6.87%) and Toronto (6.27%), while Ottawa, Vancouver, Hamilton, and Montreal showed yields below 6%.
Average asking rent for apartments and condos in selected submarkets:
| May 2026, CAD |
May 2026, USD |
YoY % May 2026 vs May 2025 |
|
| Alberta | CAD 1,663 | USD 1,212 | -4.7% |
| British Columbia | CAD 2,328 | USD 1,697 | -5.4% |
| Manitoba | CAD 1,659 | USD 1,209 | 2.1% |
| Nova Scotia | CAD 2,343 | USD 1,708 | 2.6% |
| Ontario | CAD 2,219 | USD 1,618 | -5.0% |
| Quebec | CAD 1,936 | USD 1,411 | -1.4% |
| Saskatchewan | CAD 1,391 | USD 1,014 | 0.4% |
| Canada | CAD 2,035 | USD 1,484 | -3.9% |
| Note: Exchange rate as of May 2026, USD 1 = CAD 1.3717. | |||
| Data Source: Rentals.ca. | |||
In general, the Canadian rental sector has been expanding over the long term, with the share of households renting rather than owning their residence increasing from 30.6% in 2011 to 32.2% in 2016 and 33.4% in 2021, according to Census data.
Looking ahead, the sector can be expected to continue rebalancing amid persistent affordability pressures in most submarkets, still-growing demand (despite slower population growth), and new supply coming into the market. “Conditions are expected to continue easing as new units take longer to be absorbed and competition from rental condominium apartments increases,” CMHC summarized in their 2026 mid-year market update.
Mortgage Market and Interest Rates
Interest Rates Stabilizing, Loan Originations Reach New Highs
Canada's mortgage loan interest rates:
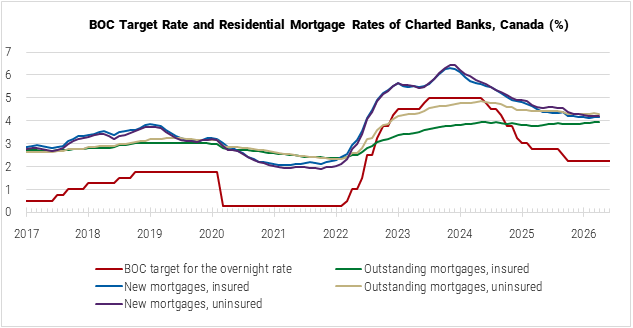
After a series of cuts in 2024 and 2025, the Bank of Canada (BOC) has kept its target rate unchanged at 2.25% since October, making no further moves at the latest monetary policy meeting in June 2026. In the corresponding press release, the regulator noted that the economic activity in Canada has been weak and uncertainty about US trade policy persists, while oil prices remain elevated due to the conflict in the Middle East. At the same time, there has been “limited evidence of broad-based pass-through of higher energy prices to other consumer prices”, and total inflation is expected to hover around 3% in the near term before easing gradually towards 2%.
Data Source: BOC.
In this environment, interest rates charged on new residential mortgages by chartered banks, while elevated compared to the pre-2022 baseline, have been stabilizing in recent months, with the gap between different loan categories narrowing. As of month-end April 2026, the weighted average interest rate reached 4.16% for new insured mortgages and 4.18% for new uninsured mortgages (both categories slightly down from the respective 4.51% and 4.61% a year ago). For existing residential mortgages, the indicator stood at 3.95% for insured loans and 4.31% for uninsured loans.
Interest rates charged on residential mortgages by chartered banks, month-end:
| April 2026 | YoY | April 2025 | YoY | April 2024 | |
| New mortgages, insured | 4.16% | ↓ | 4.51% | ↓ | 5.63% |
| - Variable rate | 3.79% | ↓ | 4.36% | ↓ | 6.97% |
| - Fixed rate, up to 1 year | 8.20% | ↓ | 8.56% | ↓ | 8.80% |
| - Fixed rate, from 1 up to 3 years | 4.63% | ↓ | 5.71% | ↓ | 6.19% |
| - Fixed rate, from 3 up to 5 years | 3.87% | ↓ | 4.05% | ↓ | 5.10% |
| - Fixed rate, 5 years and over | 3.97% | ≈ | 3.98% | ↓ | 4.92% |
| New mortgages, uninsured | 4.18% | ↓ | 4.61% | ↓ | 5.78% |
| - Variable rate | 3.88% | ↓ | 4.42% | ↓ | 6.84% |
| - Fixed rate, up to 1 year | 8.32% | ↑ | 7.91% | ↓ | 8.05% |
| - Fixed rate, from 1 up to 3 years | 4.96% | ↓ | 5.51% | ↓ | 5.93% |
| - Fixed rate, from 3 up to 5 years | 3.89% | ↓ | 4.18% | ↓ | 5.31% |
| - Fixed rate, 5 years and over | 4.18% | ↓ | 4.30% | ↓ | 5.30% |
| Outstanding mortgages, insured | 3.95% | ↑ | 3.78% | ↓ | 3.91% |
| Outstanding mortgages, uninsured | 4.31% | ↓ | 4.40% | ↓ | 4.82% |
| Data Source: BOC. | |||||
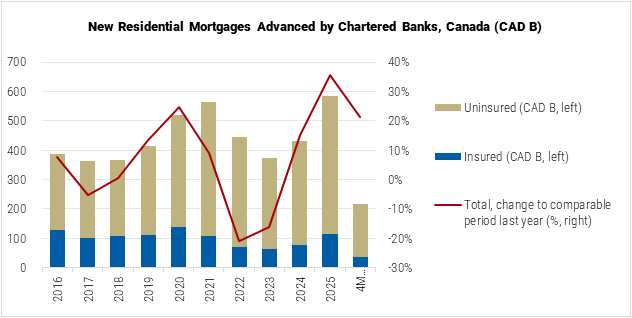
Supported by a more stable interest rate environment, loan originations continued to grow, with the total value of new residential mortgages advanced by the chartered banks demonstrating a strong 35.7% annual increase last year, exceeding the previous decade peak (2021). The momentum appears to have carried into this year, with the total value of new mortgages advanced by banks in the first four months of 2026 reaching CAD 215.4 billion (USD 156.6 billion), 21.3% above the comparable period in 2025.
Based on BOC reporting, uninsured mortgages accounted for over 83% of funds advanced in January-April 2026, a higher share compared to about 73% five years ago and 65% ten years ago. An analysis by Statistics Canada indicates that this category of loans has been driving the overall expansion of the country’s residential lending market in recent years. Uninsured mortgages, predominant since 2017, have been growing faster than insured ones due to steady increases in house prices and specifics of regulatory constraints that make homes valued over CAD 1 million (about USD 0.7 million) ineligible for insurance and require at least a 20% down payment. Consequently, uninsured mortgages are more common among single-detached homes, typically carrying higher values.
Data Source: BOC.
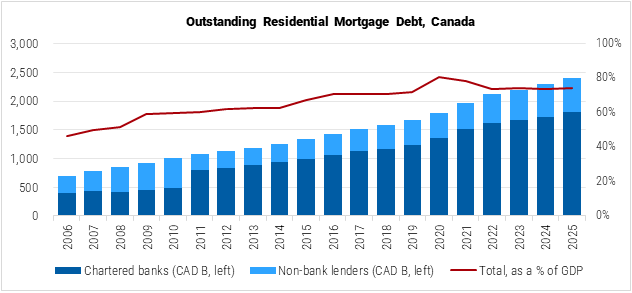
The total value of outstanding residential mortgage debt in Canada increased by 4.8% year-on-year in 2025, an accelerated growth rate compared to 4.3% in 2024 and 3.5% in 2023. The expansion was more pronounced for charted banks (5.2% year-on-year) compared to the non-bank sector of the market (3.4% year-on-year). As of April 2026, the value of residential mortgage liabilities of households in Canada stood at CAD 2.4 trillion (USD 1.8 trillion), with 24.5% of the stock held by non-bank lenders.
Sized against the Canadian economy, the residential mortgage market was estimated to reach 74.0% of GDP at current prices in 2025, the ratio down from its 2020 peak of 80.4% but remaining on an upward trajectory over the long term. As of the most recent nationwide Census (2021), 40% of all Canadian households and 60% of owner households had a mortgage on their residence.
Data Sources: Statistics Canada, OECD.
Economic and Social Factors
Economic Activity Subdued, Lower Immigration Stalls Population Growth
Amid heightened global uncertainty, Canada continues to adjust to a significant external trade shock from higher US tariffs, which disrupted tightly integrated regional supply chains and weighed on exports, investment, and confidence, reinforcing the economy’s longstanding structural challenges.
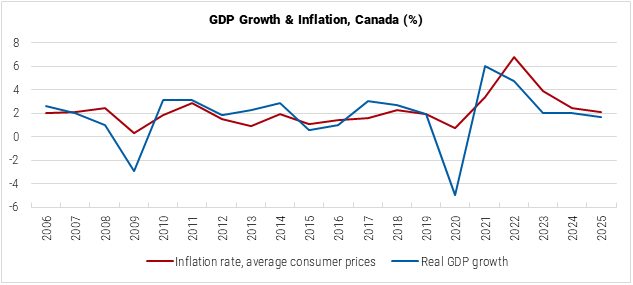
At the same time, according to the International Monetary Fund’s (IMF) assessment, the impact has been less severe than initially feared, reflecting USMCA exemptions, monetary easing, and targeted domestic support. Real GDP growth reached 1.7% in 2025 and is projected by the IMF to slow to 1.5% in 2026, before recovering to 1.9% in 2027. The Organization for Economic Co-operation and Development (OECD) offers an even more conservative projection of 1.2% and 1.7% growth rates in 2026 and 2027, respectively.
Consumer price index (CPI) inflation in the country previously eased from an annual average of 6.8% in 2022 to 2.1% in 2025 and is expected to remain close to target levels in the near term, despite picking up over the recent months due to higher energy prices. Most recently, Statistics Canada reported the indicator at 3.2% in May 2026, up from 2.8% in April and 2.3% in January. The IMF forecast anticipates inflation to average 2.5% in 2026 and 2.1% in 2027, while the OECD projects 2.4% and 2.0%, respectively.
Data Source: IMF.
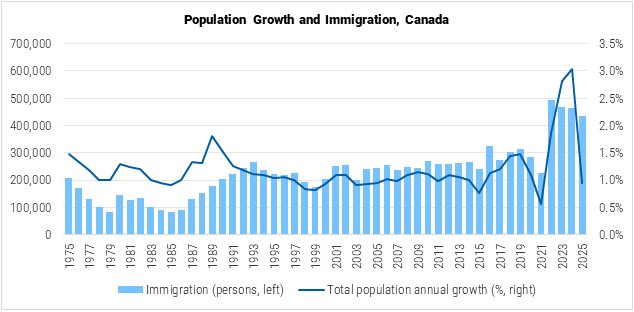
Canada’s population growth, previously boosted by record immigration flows, slowed notably in 2025, returning to long-time average levels. After three years of accelerated growth (3.0% in 2023-24, 2.8% in 2022-23, and 1.9% in 2021-22), total population growth reached just 0.9% in 2024-25, according to Statistics Canada. In parallel, international immigration eased from 493 thousand people in 2021-22, to 468 thousand in 2022-23, 464 thousand in 2023-24, and 435 thousand in 2024-25. As of Q1 2026, immigration numbers continued to decline (-20.2% compared to Q1 2025), reflecting lower targets established by Immigration, Refugees, and Citizenship Canada for the 2026 calendar year.
Note: Based on Population estimates and Estimates of the components of demograhic growth, annual, on July 1.
Data Source: Statistics Canada.
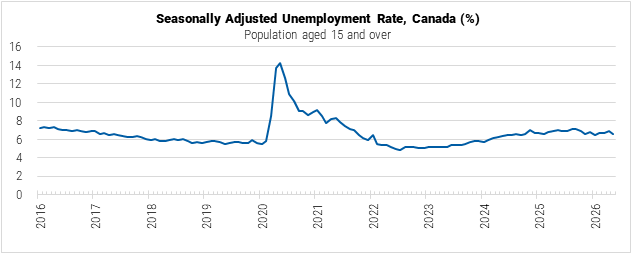
Against this background, conditions in Canada’s labor market have softened but remain broadly resilient. The nationwide unemployment rate was most recently reported by Statistics Canada at 6.6% in May 2026, down from 7.0% a year ago. According to the 2025 Article IV report from the IMF, slower inflows of temporary foreign workers have tightened labor supply in selected sectors, notably agriculture and hospitality, while nominal wage growth has eased, leaving real wage gains modest amid weak productivity growth.
Aiming to contain and adjust migration inflows to the needs of the country’s economy, the Canadian government previously capped student and temporary worker visas and planned to decrease overall permanent resident intake while allocating a greater share of admissions to high-skilled workers in critical sectors.
Data Source: Statistics Canada.
Overall, the outlook for Canada’s economy crucially depends on the outcome of trade negotiations with the United States and the eventual impact of the Middle East conflict. At the same time, while the ongoing tensions with its main trade partner, pressured supply chains, and rising energy costs continue to weigh on growth, raising the prospects of recession, the economy is “stagnating, not contracting, as weakness remains narrow rather than systemic”, according to Deloitte’s latest assessment, and way to recovery will be determined by the government’s actions to diversify trade, support business confidence, and boost investment.
Sources:
- Government of Canada
- Canada’s Immigration Levels: https://www.canada.ca/
- Supplementary Information for the 2026-2028 Immigration Levels Plan: https://www.canada.ca/
- Bank of Canada
- Policy Interest Rate: https://www.bankofcanada.ca/
- Bank of Canada Maintains Policy Rate at 2.25%: https://www.bankofcanada.ca/
- Monetary Policy Report April 2026: https://www.bankofcanada.ca/
- Exchange Rates: https://www.bankofcanada.ca/
- Interest Rates Charged for New and Existing Lending by Chartered Banks: https://www.bankofcanada.ca/
- Funds Advanced and Outstanding Balances for New and Existing Lending by Chartered Banks: https://www.bankofcanada.ca/
- Statistics Canada
- Canada’s Population Estimates, First Quarter 2026: https://www150.statcan.gc.ca/
- Canada's Population Estimates: Age and Gender, July 1, 2025: https://www150.statcan.gc.ca/
- 2021 Census of Population Key Indicators: https://www12.statcan.gc.ca/
- Credit Liabilities of Households: https://www150.statcan.gc.ca/
- Key Trends in Mortgage and Non-Mortgage Loans: https://www150.statcan.gc.ca/
- Labour Force Survey, May 2026: https://www150.statcan.gc.ca/
- Consumer Price Index, May 2026: https://www150.statcan.gc.ca/
- Canada Mortgage and Housing Corporation (CMHC)
- Housing Starts and Construction Data for May 2026: https://www.cmhc-schl.gc.ca/
- Housing Shortages in Canada: https://www.cmhc-schl.gc.ca/
- 2026 Mid-Year Rental Market Update: https://www.cmhc-schl.gc.ca/
- Housing Market Outlook 2026: https://www.cmhc-schl.gc.ca/
- Teranet and National Bank of Canada
- Teranet-National House Price Index: https://housepriceindex.ca/
- Prices Continue to Fall for the Sixth Consecutive Month: https://housepriceindex.ca/
- The Canadian Real Estate Association (CREA)
- Monthly Housing Market Statistics: https://stats.crea.ca/
- Quarterly Housing Market Forecasts: https://www.crea.ca/
- International Monetary Fund (IMF)
- Country Overview: Canada: https://www.imf.org/
- 2025 Article IV Staff Report: https://www.imf.org/
- Organization for Economic Co-operation and Development (OECD)
- OECD Data Explorer: https://data-explorer.oecd.org/
- OECD Economic Outlook, Volume 2026 Issue 1: Canada: https://www.oecd.org/
- Canada Economic Snapshot: https://www.oecd.org/
- Deloitte
- Canada Economic Outlook, Summer 2026: https://www.deloitte.com/
- Rentals.ca
- June 2026 Rent Report: https://rentals.ca/
- TD Economics
- Canadian Housing Starts (May 2026): https://economics.td.com/
- RBC Economics
- Delayed Start to Spring for Canada’s Housing Market: https://www.rbc.com/