France's Residential Property Market Analysis 2026
France's housing recovery lasted four quarters. Prices in the existing-home market are falling again, the European Central Bank has started raising rates for the first time in three years, and the professional bodies that were forecasting close to a million sales this year have cut their numbers by roughly 60,000.
This extended overview from Global Property Guide covers key aspects of the French housing market and takes a closer look at its most recent developments and long-term trends.
- Property Prices and Price Index
- Historic Perspective
- Property Demand Trends
- Property Supply Trends
- Rental Market: Rents and Rental Yields
- Mortgage Market and Interest Rates
- Economic and Social Factors
Property Prices and Price Index
The stabilization that defined the French housing market through 2025 has ended. According to provisional figures from the National Institute for Statistical and Economic Studies (INSEE), prices of existing dwellings in France, excluding Mayotte, fell by 1.0% quarter-on-quarter in Q2 2026, after a 0.2% decline in Q1 and a 0.4% rise in Q4 2025. Over twelve months, prices are down 0.8%, following a flat first quarter and a 1.0% gain in the final quarter of last year.
France's house price annual change:
This is a clean reversal of the picture presented in our February 2026 edition, which described a market entering "a clearer stabilization phase with modest nominal sales price increases." Four consecutive quarters of positive annual growth, running from Q1 2025 to Q4 2025, have given way to two quarters of decline.
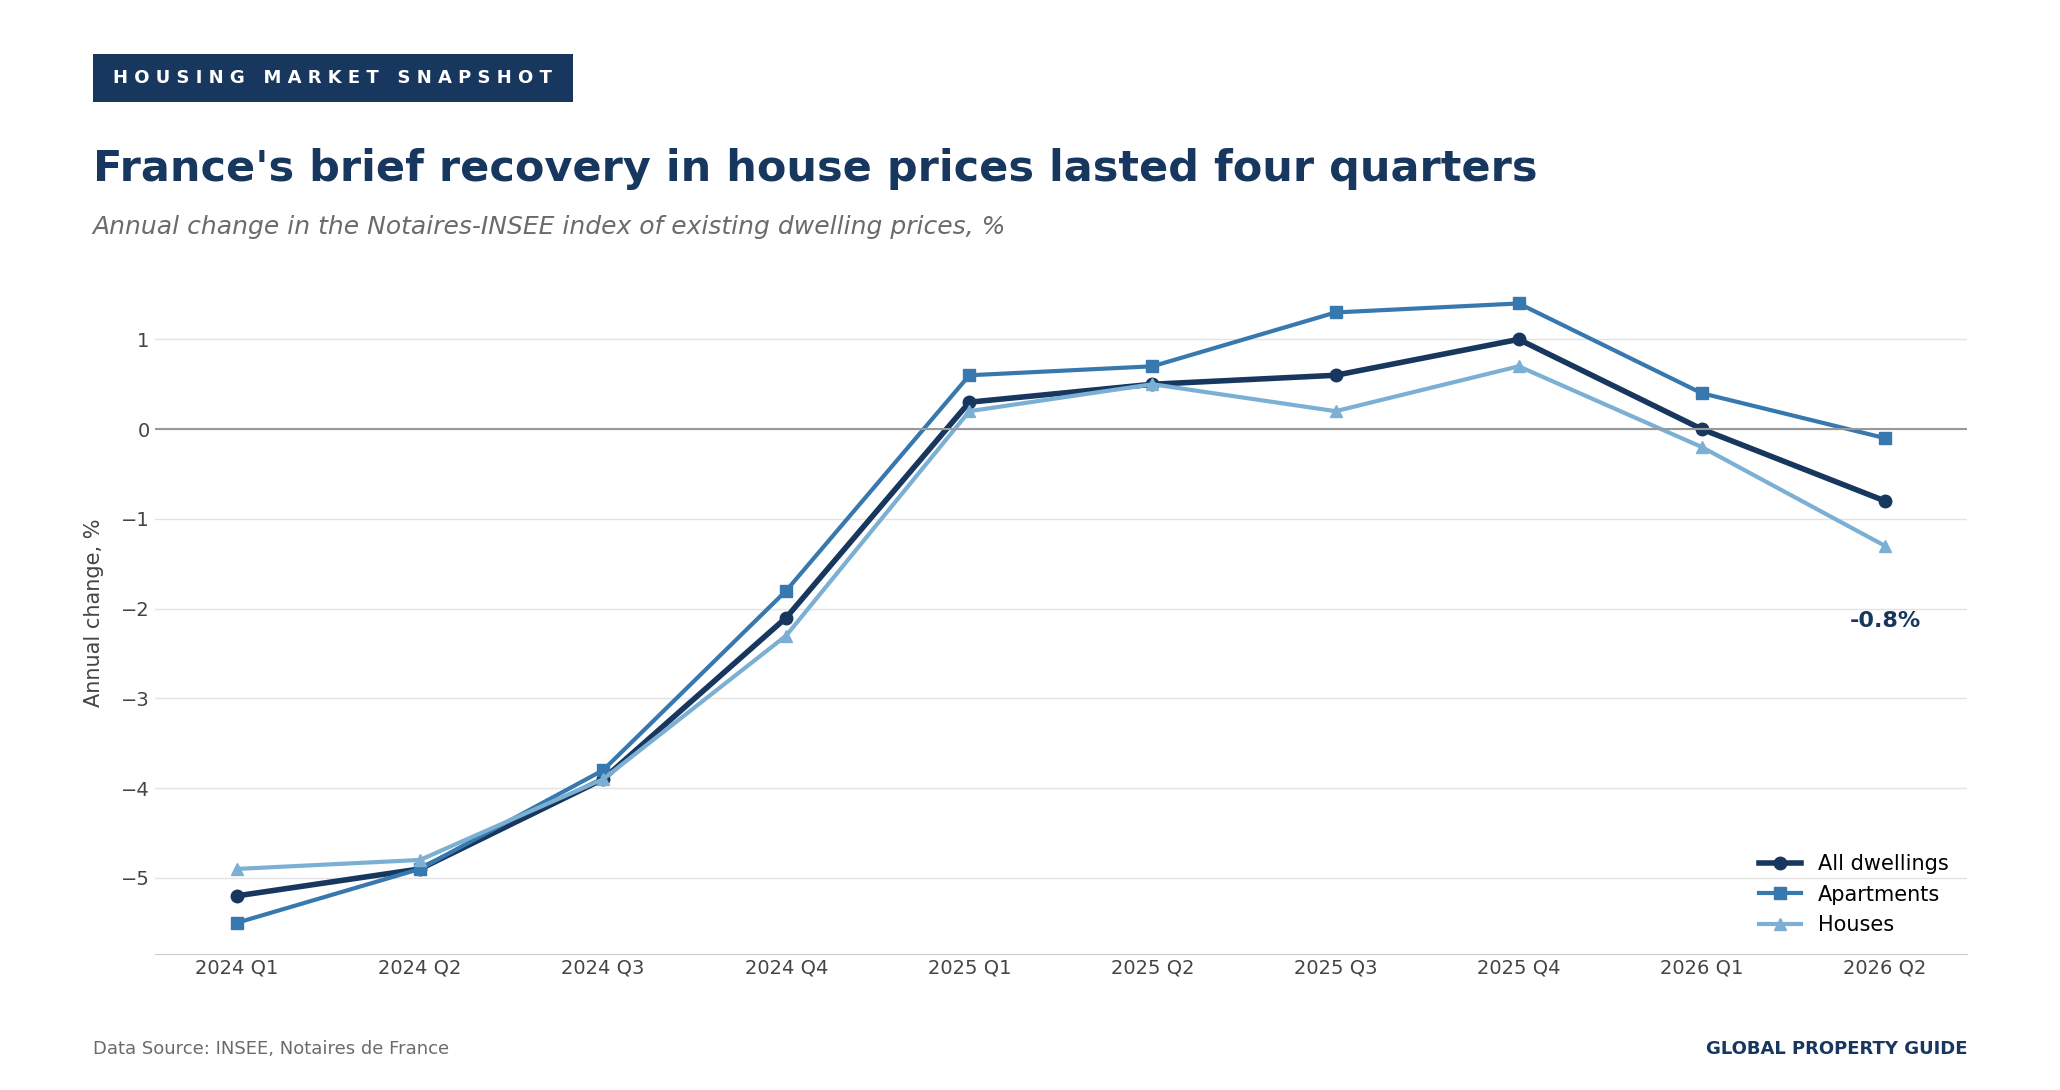
The correction is not evenly distributed. Apartment prices are essentially flat over twelve months, down 0.1%, while house prices have fallen 1.3%. The same split shows up geographically: prices in the provinces are down 1.0% year-on-year against 0.3% in Ile-de-France. Within the capital region, apartments are still marginally positive at 0.3% while houses have lost 1.5%.
Paris itself remains the outlier. Notaries of Greater Paris report existing apartment prices in the capital at EUR 9,560 (USD 11,105) per square metre in Q2 2026, up 0.6% on the year, with the underlying index barely moved since the end of 2025. Across the wider region, apartments average EUR 6,130 (USD 7,121) per square metre, a level the notaries note has held between roughly EUR 6,100 and EUR 6,200 for more than two years.
| Price dynamics of existing dwellings in the Ile-de-France region | |||
| Price per sqm (EUR), Q2 2026 | Price per sqm (USD), Q2 2026 | YoY, % | |
| Ile-de-France | EUR 6,130 | USD 7,121 | 0.3% |
| Paris | EUR 9,560 | USD 11,105 | 0.6% |
| Petite Couronne | EUR 4,890 | USD 5,680 | -0.1% |
| Hauts-de-Seine | EUR 5,940 | USD 6,900 | 0.4% |
| Grande Couronne | EUR 3,200 | USD 3,717 | 0.1% |
| Houses, Ile-de-France (average price) | EUR 320,000 | USD 371,712 | -1.5% |
| Note: Index-derived price per sqm. Exchange rate as of 10 September 2026, EUR 1 = USD 1.1616. | |||
| Data source: Notaries of Greater Paris. | |||
Within Paris, the spread between arrondissements is wide and widening at the top. Standardized prices run from EUR 7,690 (USD 8,932) per square metre in the 19th to EUR 13,980 (USD 16,239) in the 6th, which is both the most expensive arrondissement and the fastest-rising at 5.0% over the year. The 15th, at the other end, is down 1.1%.
The negotiating environment described in our previous edition has, if anything, hardened further in buyers' favour. The notaries report that buyers can now be "particularly demanding," and that homes priced above what the market will bear attract no offers at all rather than low ones. Seller behaviour has become the binding constraint: owners sitting on a large capital gain will revise their expectations, while those who bought more recently resist, and the result is transactions that simply do not happen.
The National Real Estate Federation of France (FNAIM) puts the same point more bluntly. Presenting the first-half review in June, FNAIM president Loic Cantin said France is "bel et bien face à une crise du logement," a housing crisis in the full sense. The federation's segment figures show apartments up 1.8% year-on-year to EUR 3,838 (USD 4,458) per square metre and houses down 1.6% to EUR 2,357 (USD 2,738), with the national average down roughly 2.5% once inflation is accounted for.
Historic Perspective
A Short Recovery Inside a Longer Correction
France entered a prolonged upswing after the post-1990s recovery, culminating in the mid-2000s. Price growth accelerated into 2006 and 2007 on favourable credit conditions, improving household confidence, and a policy environment that actively supported investment demand and new development.
The global financial crisis marked the turning point. From late 2008, tighter financial conditions and weaker sentiment triggered a correction in transaction pricing while construction retrenched. A short cyclical recovery followed through 2010 and 2011, supported by the broader economic rebound and initially accommodative financing.
From 2012 to 2015, the market moved into a softer phase, reflecting weaker demand momentum, reduced fiscal incentives and a more cautious credit environment. Prices drifted down gradually rather than sharply, consistent with slow adjustment in a resilient owner-occupier market.
From 2016, the cycle shifted back to expansion. Price growth resumed and held through the pandemic, when demand proved unusually resilient while supply stayed constrained. The cycle turned again from 2022 as monetary tightening met a high-inflation environment: nominal gains faded, real prices fell, and the adjustment deepened through 2023 and 2024 as affordability tightened and liquidity thinned.
The 2025 Rebound Now Looks Like an Interruption, Not a Turn
What the long series shows is that 2025 was a single positive year inserted into a correction that began in 2023 and has now resumed. Nominal prices fell 3.88% in 2023 and 2.18% in 2024, recovered 1.11% in 2025, and have turned negative again in the first half of 2026. On an inflation-adjusted basis, the picture is starker still: real prices fell 7.33% in 2023 and 3.40% in 2024, and managed only 0.23% of real growth in 2025.
| 20-year annual house price change (based on end-of-year price index of existing dwellings), Metropolitan France | ||||||
| Year | Nominal house prices (%) | Inflation-adjusted house prices (%) | Year | Nominal house prices (%) | Inflation-adjusted house prices (%) | |
| 2006 | 9.91 | 8.49 | 2016 | 1.50 | 0.99 | |
| 2007 | 5.47 | 3.05 | 2017 | 3.25 | 2.09 | |
| 2008 | -3.75 | -5.41 | 2018 | 3.24 | 1.32 | |
| 2009 | -4.09 | -4.44 | 2019 | 3.79 | 2.68 | |
| 2010 | 7.60 | 5.85 | 2020 | 6.41 | 6.32 | |
| 2011 | 3.68 | 1.21 | 2021 | 7.02 | 4.19 | |
| 2012 | -1.96 | -3.44 | 2022 | 4.61 | -1.38 | |
| 2013 | -1.81 | -2.45 | 2023 | -3.88 | -7.33 | |
| 2014 | -2.52 | -2.78 | 2024 | -2.18 | -3.40 | |
| 2015 | -0.50 | -0.60 | 2025 | 1.11 | 0.23 | |
| Data sources: INSEE, OECD, Global Property Guide. | ||||||
With consumer price inflation back above 2% and nominal prices falling, the real-terms decline in 2026 will be considerably larger than the nominal headline suggests. That arithmetic, rather than the modest nominal fall, is the substantive story of the current year.
Demand Highlights
Volumes Have Stopped Rising, and Forecasts Have Been Cut
The recovery in transaction volumes that ran from late 2024 through 2025 has flattened out. INSEE estimates 958,000 existing-home transactions in the twelve months to the end of June 2026, against 953,000 at the end of March and 952,000 at the end of December 2025. The institute's own description is that the annual volume "se stabilise depuis le début de l'annee," stabilizing since the start of the year, after recovering between October 2024 and December 2025.
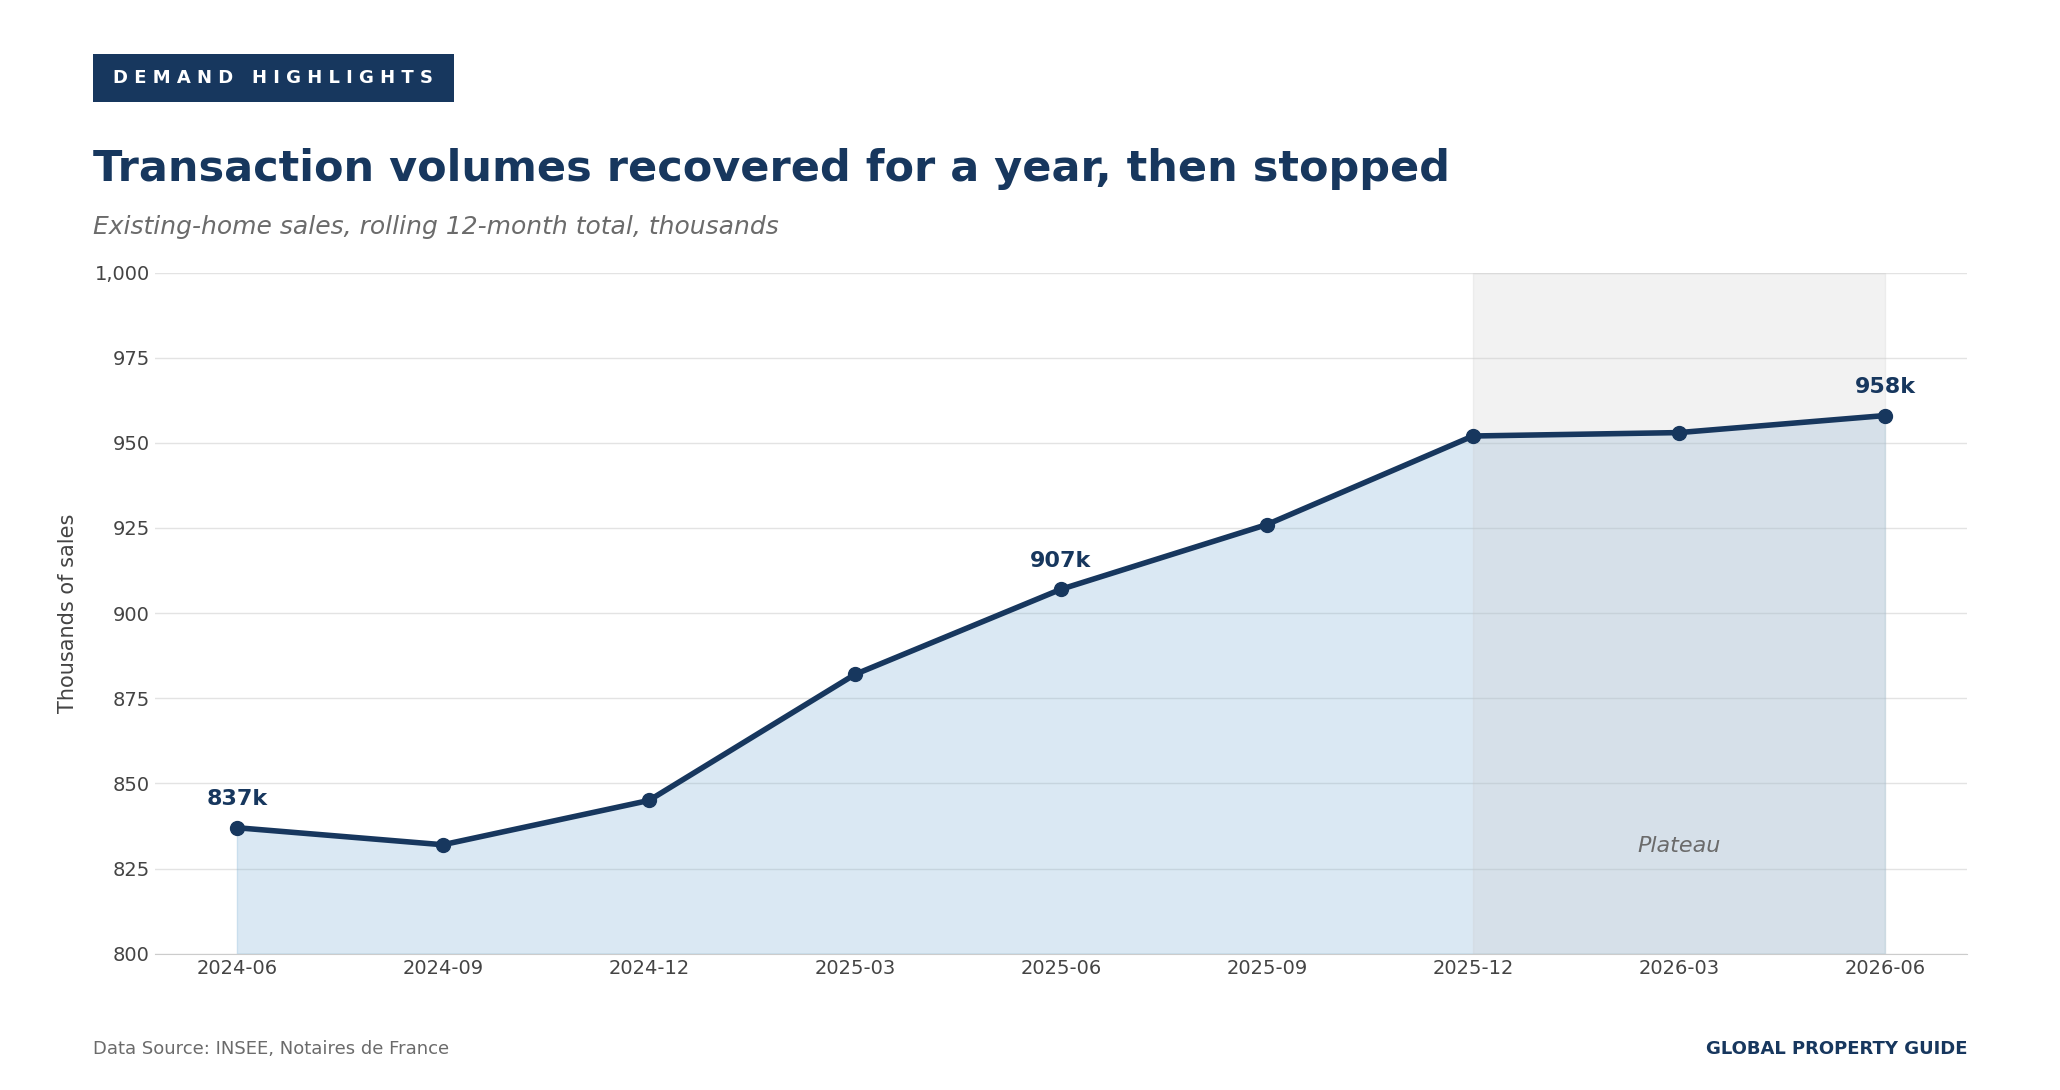
Measured against the year before, volumes are still up 5.6%, from 907,000 at the end of June 2025. Measured against the last six months, they are up 0.6%. The first number describes the recovery; the second describes its end.
Context matters here. Sales over the last twelve months represent 2.5% of the dwelling stock, unchanged from the first quarter, a share INSEE notes is close to its level in the early 2000s and well below the 3.3% peak reached in Q3 2021. In absolute terms, 958,000 sales remain 23% below the 1,248,000 recorded at that peak.
Our February 2026 edition reported FNAIM expecting between 960,000 and 980,000 transactions in 2026. The federation has since cut that forecast sharply. At its June press conference, FNAIM put the likely full-year outcome at 900,000 to 920,000 sales, a decline of 5% to 6% against 2025, attributing the break to the Middle East conflict, the resulting energy shock, and mortgage rates turning back upward.
Ile-de-France Is Recovering, But From a Base That Was Artificially Depressed
Regional data require care this quarter. Notaries of Greater Paris recorded 31,750 sales of existing dwellings in Ile-de-France between April and June 2026, up 10% year-on-year, with apartments up 11% to 23,070 and houses up 8% to 8,680. Paris posted the strongest gain at 20%, against 11% in the Petite Couronne and just 4% in the Grande Couronne.
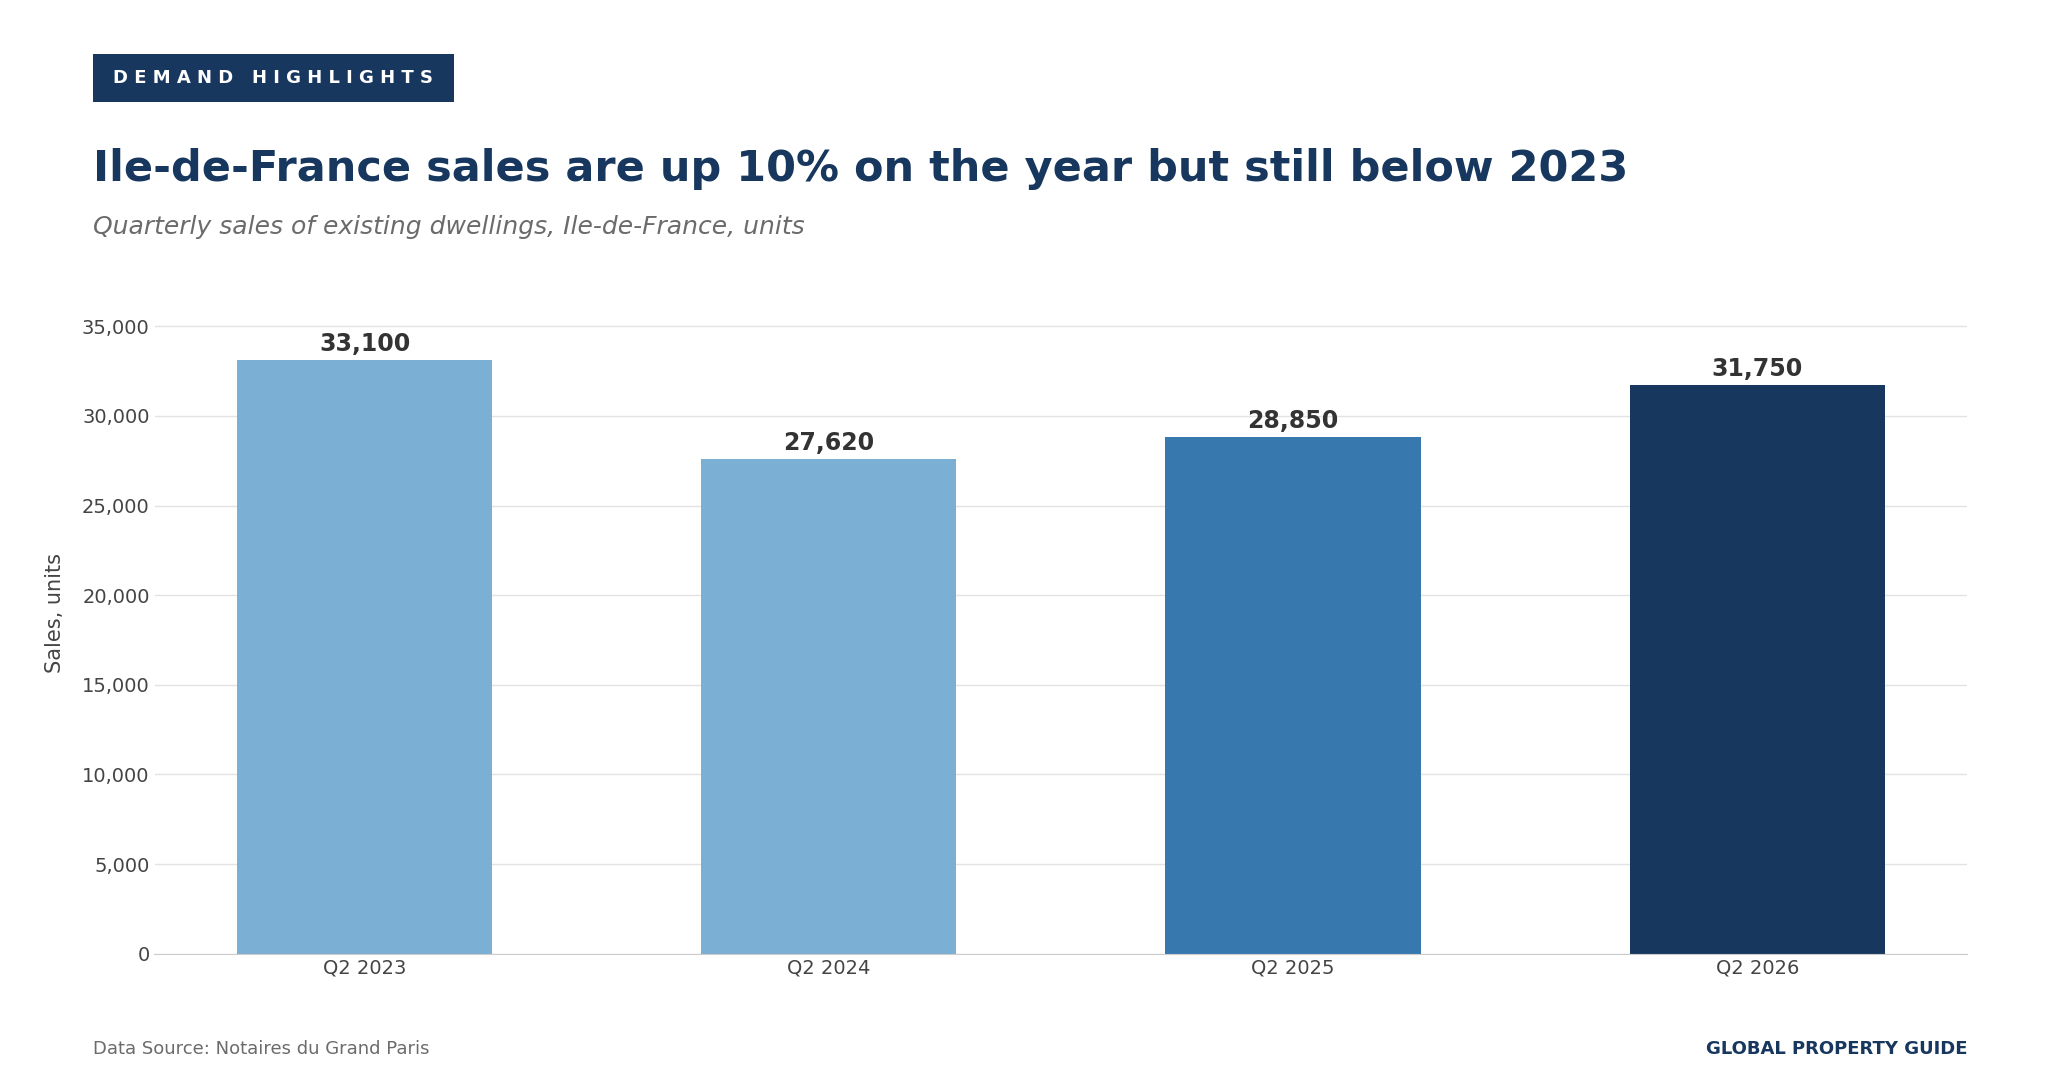
The notaries themselves caution against reading this as acceleration. Q2 2025, the comparison base, was depressed because buyers had rushed transactions into Q1 2025 to get ahead of transfer-duty increases in several departments. Smoothing across the whole first half removes that distortion and produces a far more modest picture: apartment sales up 4% and house sales up 7% against the first half of 2025. On that basis, the notaries say the figures confirm "une amelioration de l'activite" but do not yet justify calling it a general recovery. Activity remains 4% below the equivalent quarter of 2023.
The composition of demand has also shifted. First-time buyers are returning selectively, mainly those with a deposit or family support. Second-time buyers are struggling, particularly where selling means giving up a mortgage taken at far better rates. Rental investment, in the notaries' own words, remains "extremement limite" in the existing-stock market.
Property Supply Trends
Permits Have Stalled, Starts Are Catching Up, and New-Build Demand Is Falling
The supply picture has become genuinely mixed, and reading it correctly requires separating the monthly noise from the twelve-month totals.
According to the Statistical Data and Studies Department (SDES), 370,673 dwellings were authorized for construction in the twelve months to July 2026, 9.5% below the average of the previous five years. In July alone, authorizations fell 2.5% month-on-month to 29,577 units, after a 5.6% decline in June and a 17.8% jump in May. Starts are on a better trajectory: 27,677 dwellings were started in July, up 8.9% on June, after stability in June and a 3.4% dip in May.
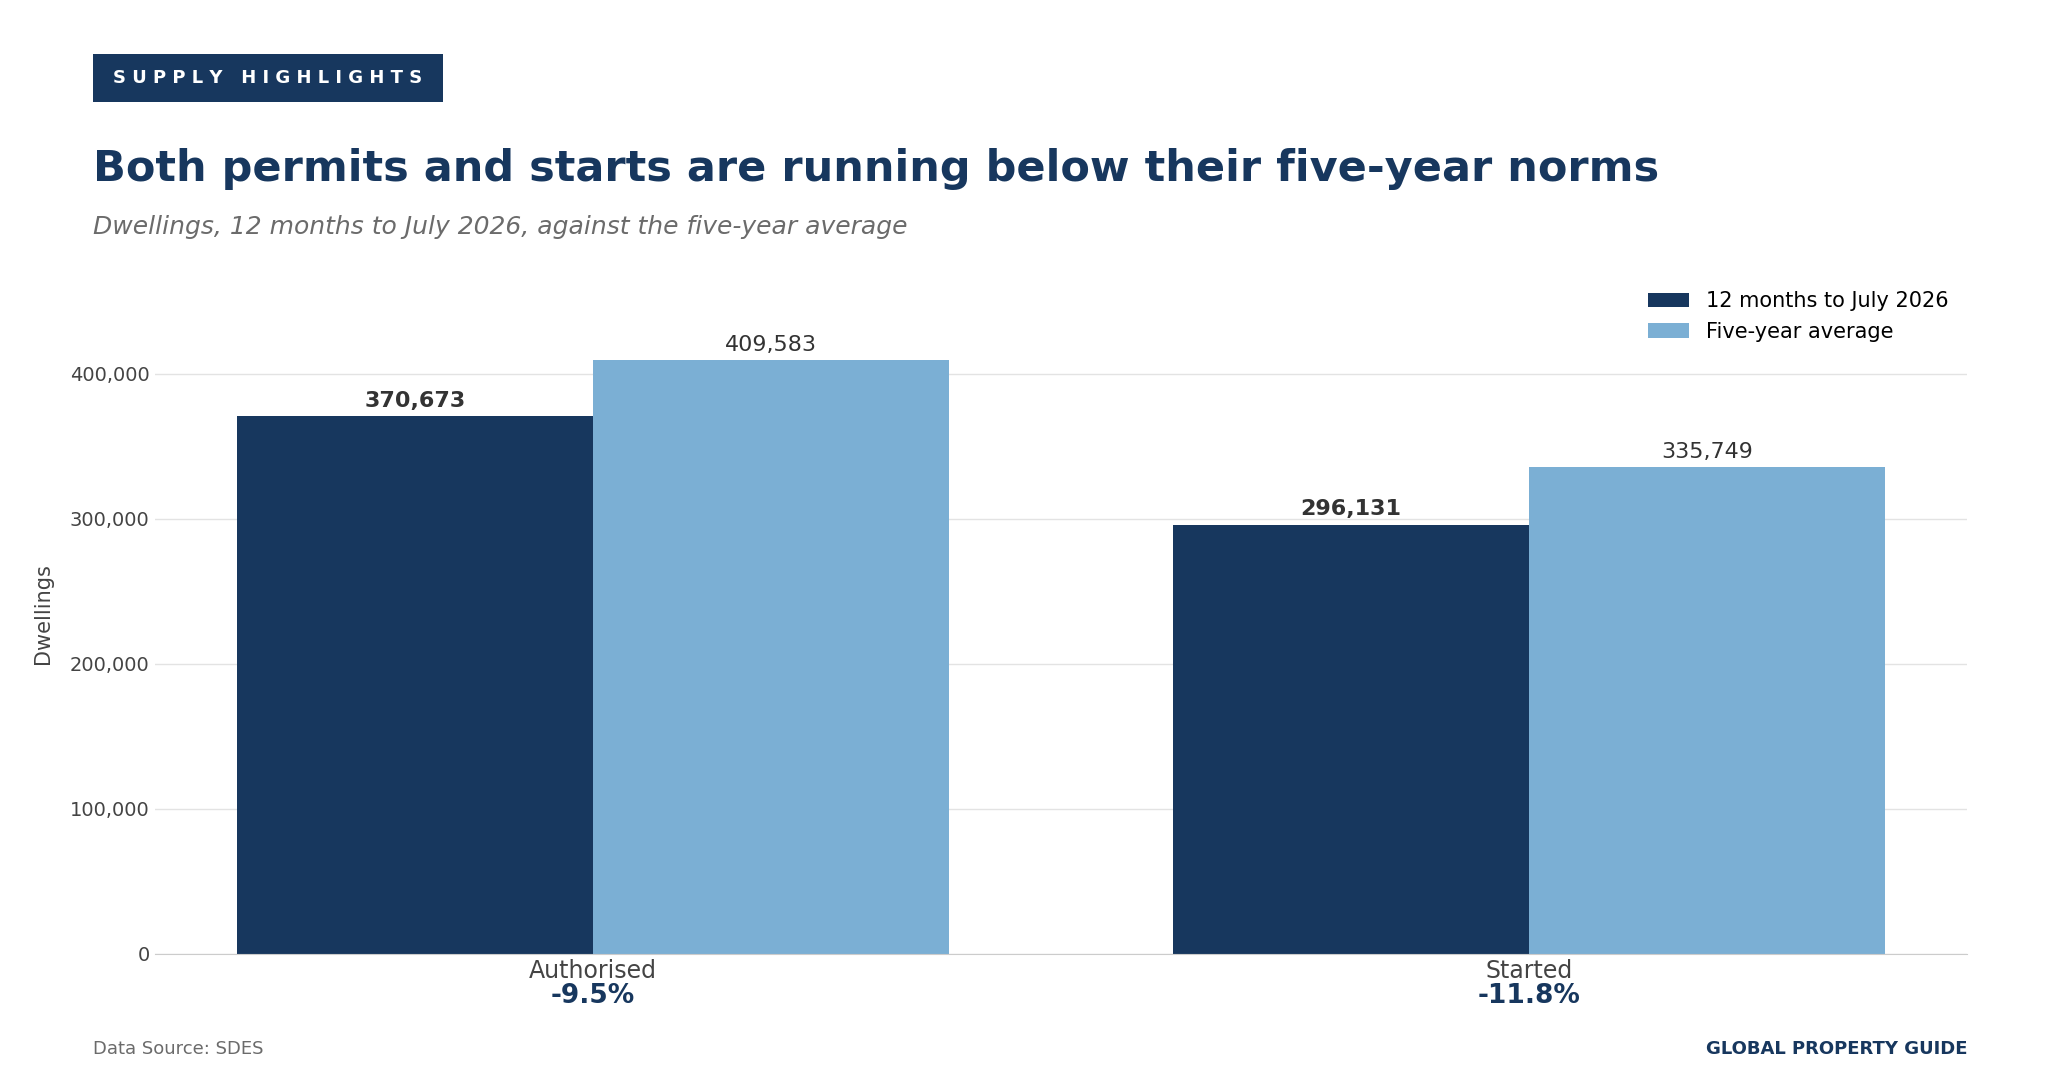
SDES offers one genuinely encouraging comparison. Averaged over the first seven months of 2026, monthly authorizations are running 1.4% above the level recorded across the whole of 2025. The market is not collapsing; it is failing to climb back to a normal production rate. The twelve-month authorization total of 370,673 also sits below the 379,222 recorded for calendar 2025, so the improvement within 2026 has not yet been enough to lift the rolling total.
New-Build Marketing Has Tipped Into Oversupply
The clearest deterioration is in the new-build market, where the relationship between what developers launch and what buyers reserve has inverted.
In Q2 2026, 16,112 new dwellings were reserved by individual buyers, down 4.8% on the quarter after a 5.9% rise in Q1. Apartments in collective housing fell 4.6% and individual houses 7.6%. Over the same three months, developers put 17,499 units on sale, up 11.1% after a 7.3% decline in the previous quarter, with apartments up 10.0% and houses up 37.0%.
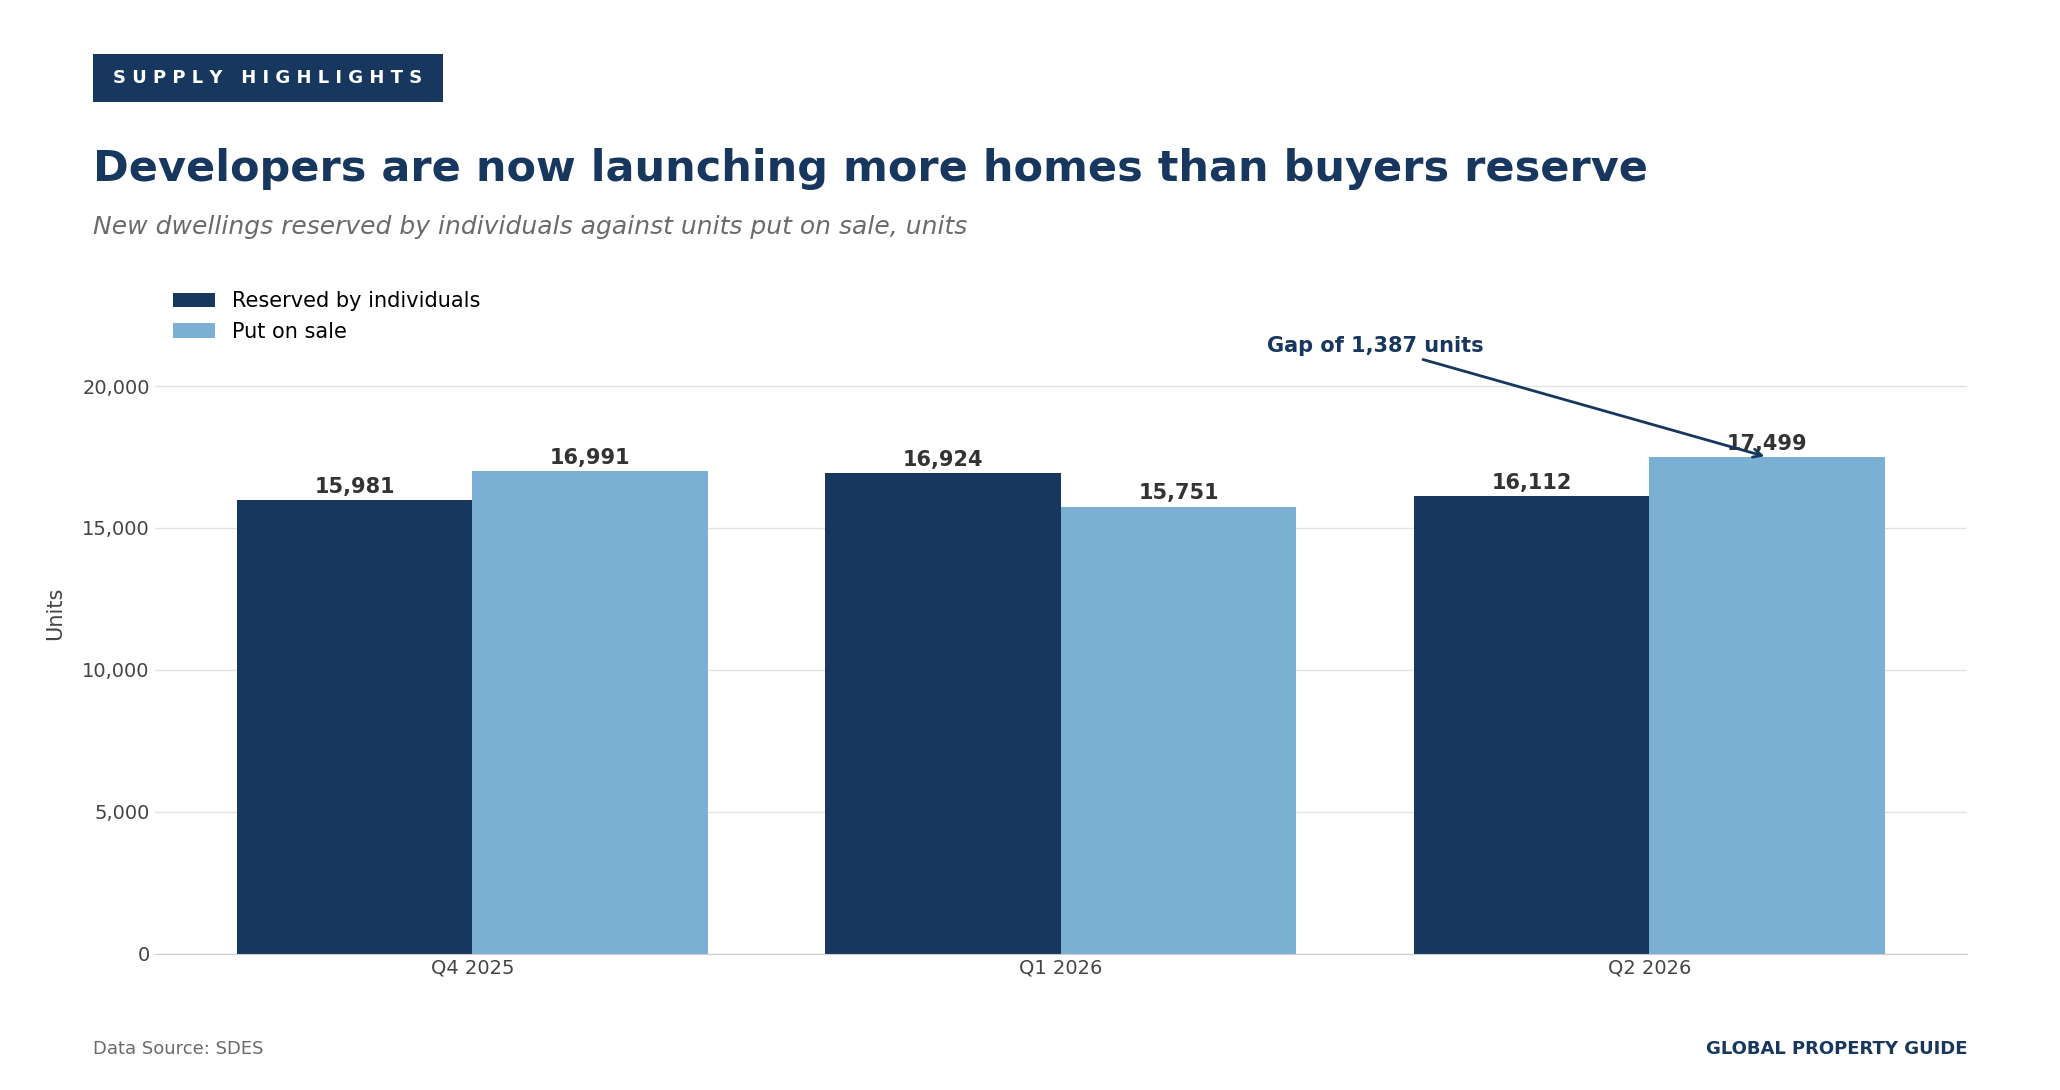
For the first time in this cycle, launches exceed individual reservations by 1,387 units. Institutional demand has not filled the gap: block sales came to 13,103 units in Q2 2026, down 3.2% on the quarter, with reservations by social landlords down 6.9%. Individual buyers accounted for 55.1% of all new-home reservations and block buyers 44.9%.
The forward-looking commentary from the professional bodies in our previous edition was explicitly conditional. The French Building Federation projected a "slight rebound without a real recovery" and housing starts of around 296,000 units in 2026, but made that scenario dependent on the adoption and rollout of a private landlord status within the 2026 finance framework. That condition has now been met, as set out in the rental section below, and starts over the twelve months to July 2026 came in at 296,131. The forecast has been hit almost exactly. What has not followed is the demand needed to absorb the output.
One methodological point deserves attention. From March 2026, SDES produces construction statistics from the Sitadel3 system, which replaces Sitadel2. The change has slightly revised previously published data, and for the moment the series is only available from 2013 onward, which limits long-run comparisons of construction activity.
Rental Market: Rents and Rental Yields
The Rent Cap Turns Up While Market Rents Keep Slowing
The rental market has produced the quarter's most counterintuitive result: the legal ceiling on rent increases has accelerated while actual rents in the private sector have continued to decelerate.
France's rent price index:
The INSEE rent reference index (IRL), which sets the maximum permissible increase on sitting tenancies, rose 1.15% year-on-year in Q2 2026 to 148.37, after 0.78% in Q1 and 0.79% in Q4 2025. That is the first acceleration since the index was released from the 3.5% cap that applied between Q3 2022 and Q1 2024, and it is a direct consequence of returning inflation, since the IRL is constructed from the consumer price trend.
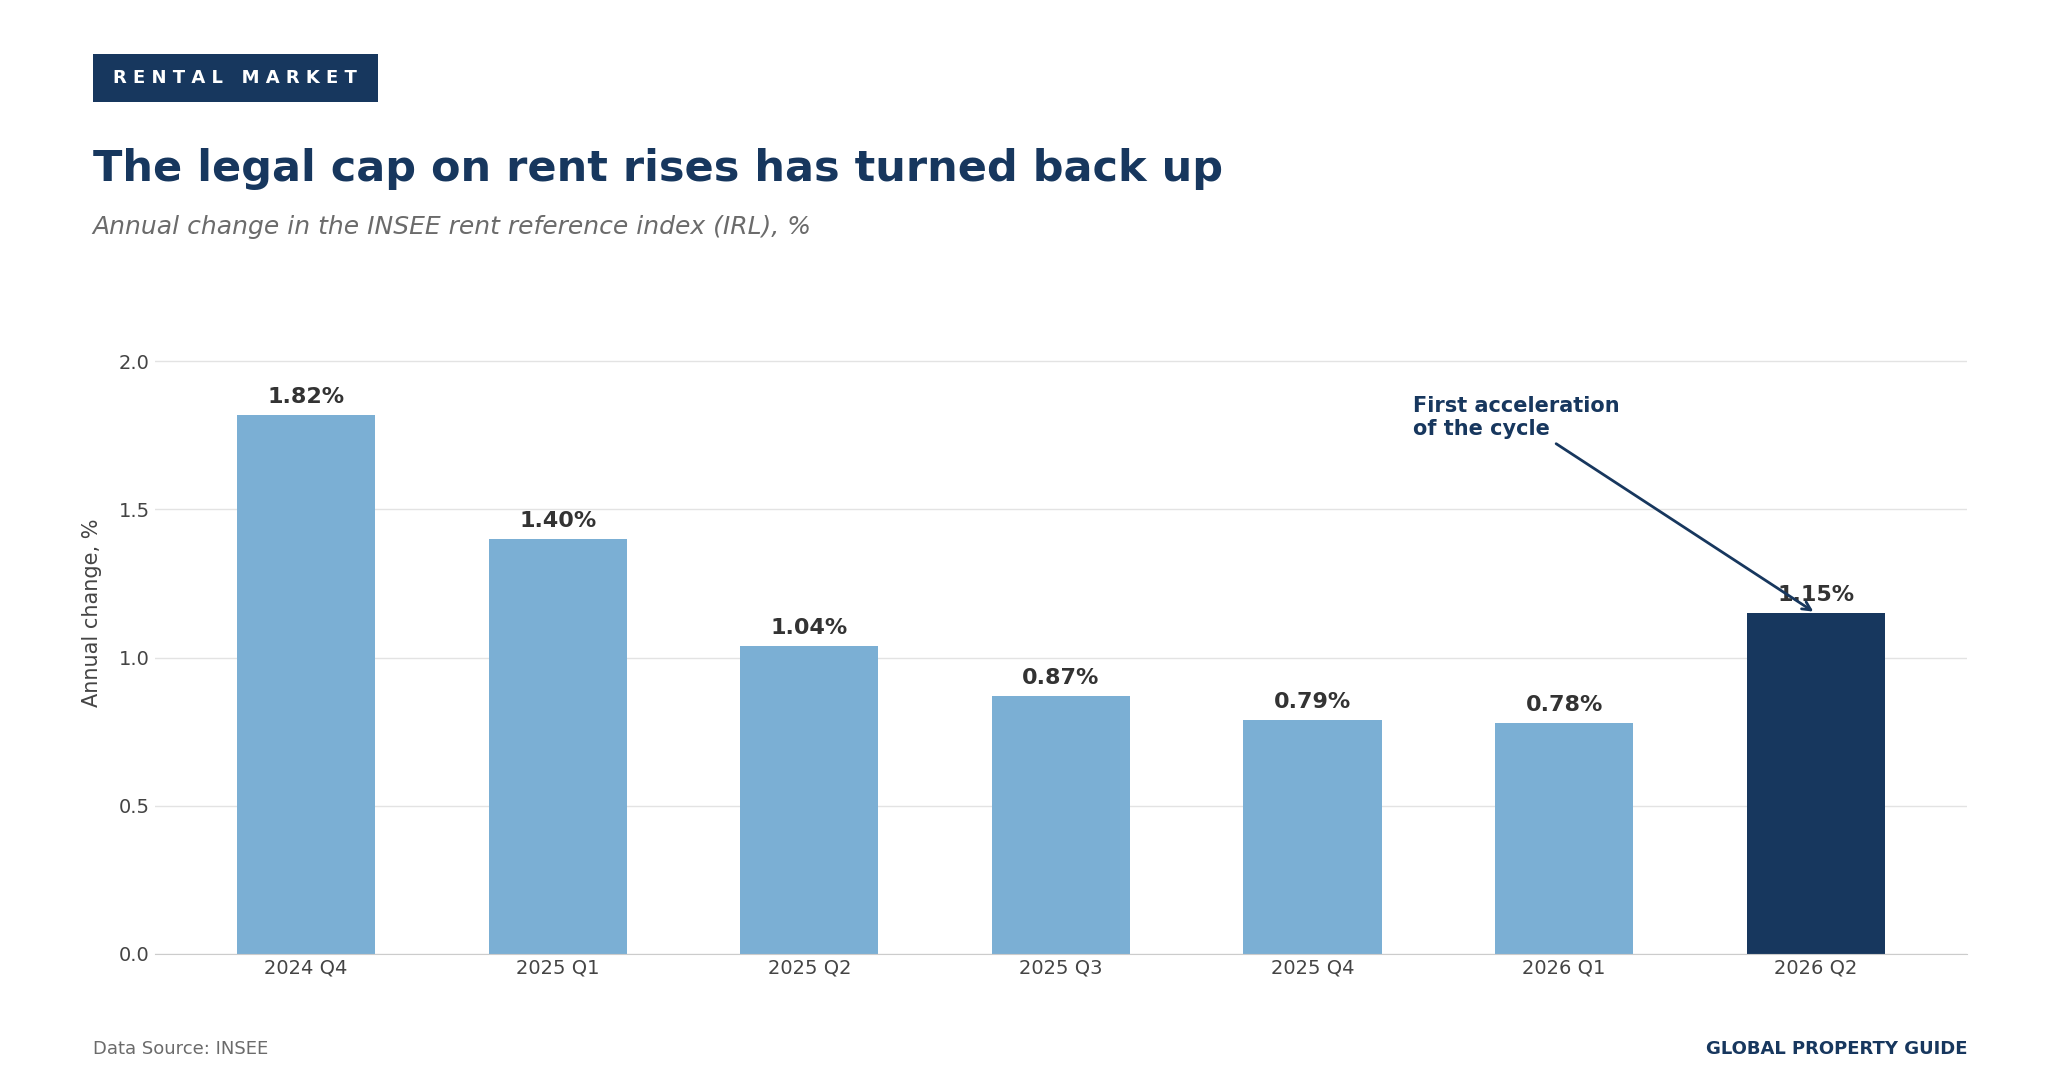
Our February 2026 edition reported the IRL as continuing to decelerate. It no longer is. Landlords indexing in the second half of 2026 can raise sitting rents by 1.15% rather than the 0.78% available a quarter earlier.
Actual rents tell a different story. The INSEE housing rent indices show rents excluding charges up 1.6% year-on-year in April 2026, after 1.7% in January and 2.6% in October 2025. The private sector, including 1948-law tenancies, slowed to 1.0% from 1.2% in January and 1.4% in October. The social sector continues to run far ahead at 2.7%. In Paris, the overall figure is 1.2%, with the private sector at 0.9% and the social sector at 1.8%.
The gap between a rising cap and falling market rent growth is the point. The IRL constrains what landlords may charge existing tenants; it does not create the demand needed to realize it. With the private sector decelerating toward 1%, the cap is becoming less binding rather than more.
Yields Are Flat Nationally, But the City Ranking Has Reshuffled
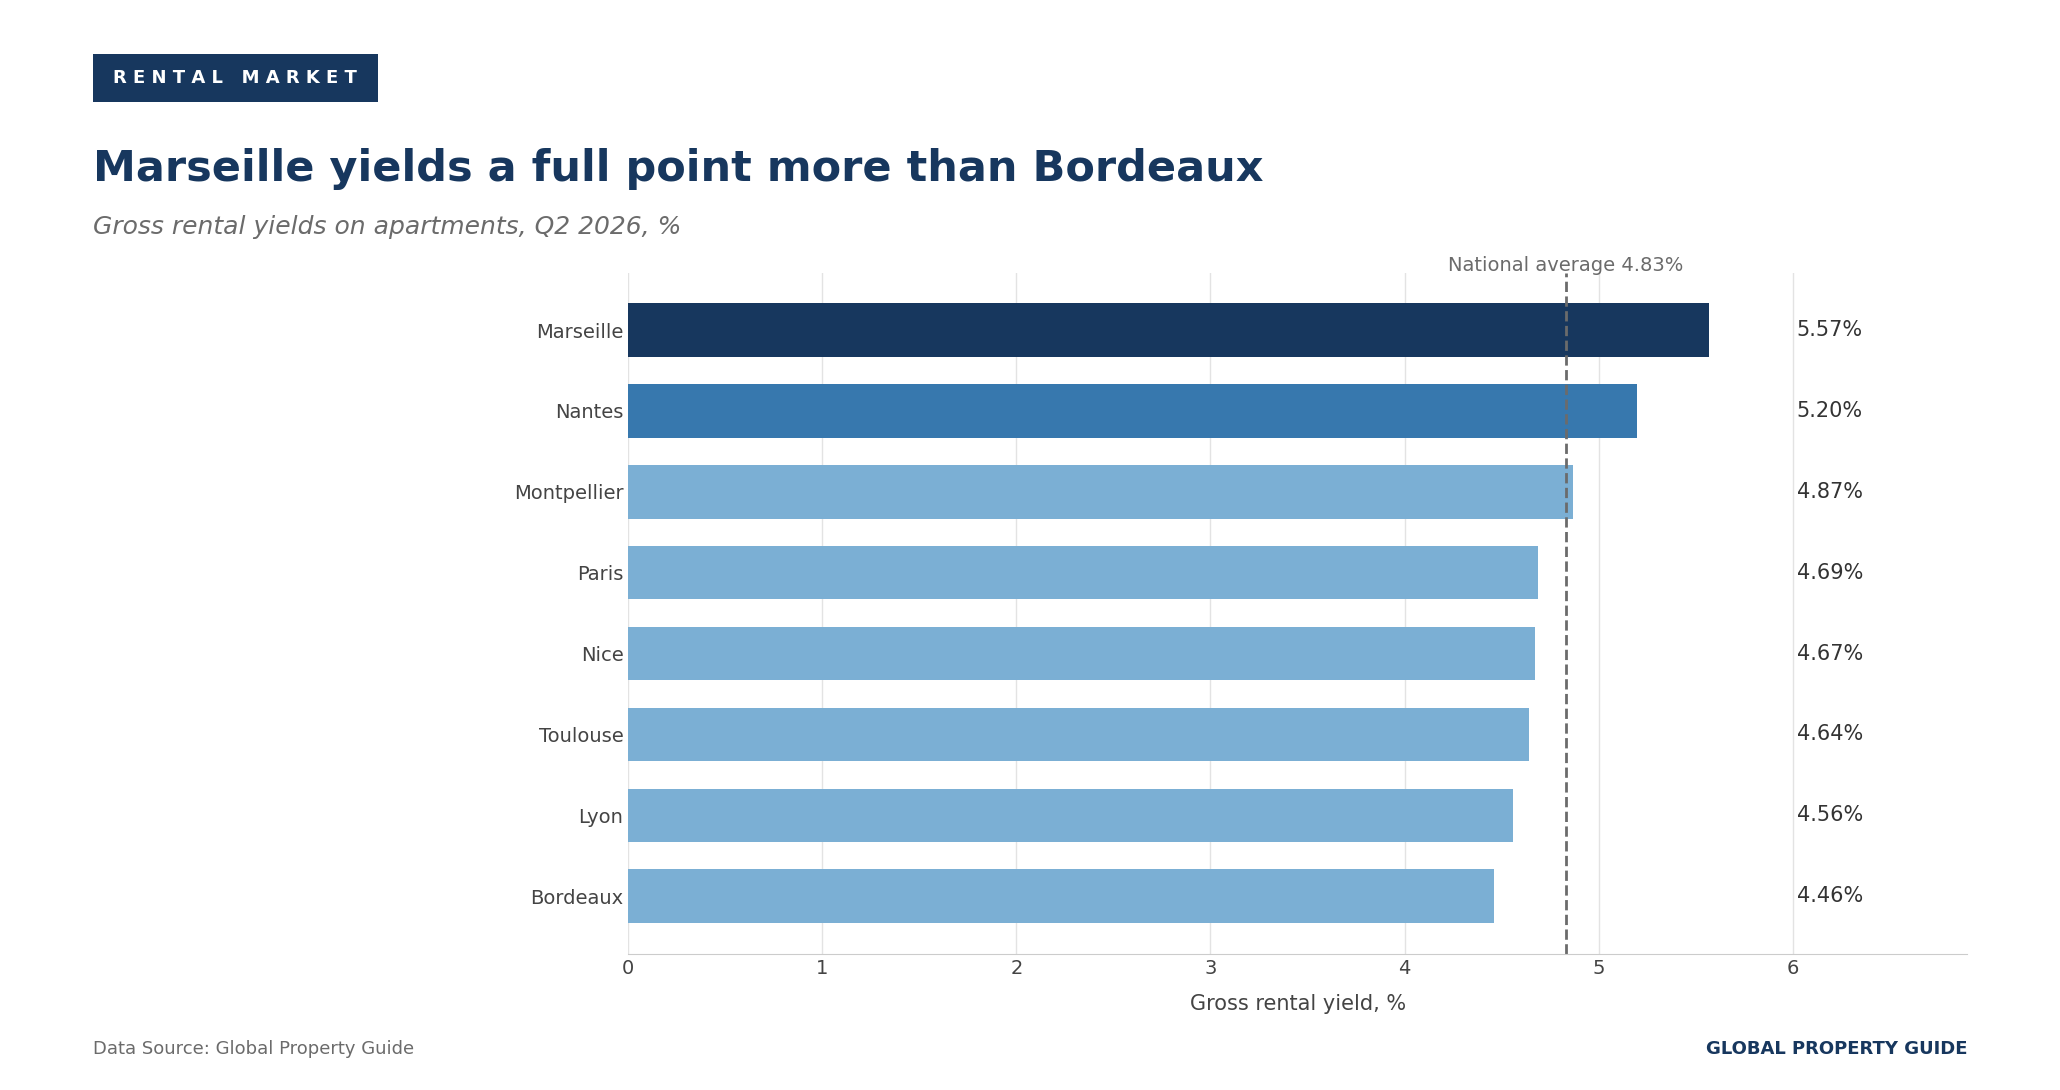
Research conducted by Global Property Guide in June 2026 shows gross rental yields on French residential units averaging 4.83% in Q2 2026, essentially unchanged from the 4.84% recorded in Q4 2025 and up from 4.63% in Q2 2025.
The national stability conceals substantial movement underneath. Marseille remains the highest-yielding city surveyed at 5.57%, up from 5.45% six months earlier, followed by Nantes at 5.20% and Montpellier at 4.87%. Paris has fallen from 5.24% to 4.69%, a decline of 55 basis points that moves it from second place to fourth. Bordeaux, at 4.46%, has replaced Lyon as the lowest-yielding market in the survey.
A New Landlord Regime Has Replaced Pinel
The regulatory question left open in our previous edition has been settled. The 2026 finance law, law no. 2026-103 of 19 February 2026, created a private landlord status in its article 47, a scheme widely known as the Jeanbrun regime after housing minister Vincent Jeanbrun. It applies to acquisitions made between 21 February 2026 and 31 December 2028.
The mechanism differs fundamentally from the Pinel scheme it replaces. Pinel granted a reduction in tax due, calculated on the purchase price. The new regime instead permits annual tax amortization of the building, with land valued at a flat 20% of the acquisition price, deducted from property income. Rates run from 3.5% a year for intermediate rents, capped at EUR 8,000, to 5.5% for very social rents, capped at EUR 12,000, with lower rates for renovated existing stock. The regime requires unfurnished letting of a principal residence in a collective building for at least nine years, under rent and tenant-income caps, and applies nationwide without zoning restrictions.
Early evidence on take-up is modest. Notaries of Greater Paris, reporting in September, described the scheme as still ramping up and judged that it has so far produced only "un retour encore mesure" of investors, a measured return at best.
The structural constraints on rental supply identified in previous editions remain in place. Homes rated G under the energy performance diagnostic can no longer be let, with F-rated properties following in 2028 and E-rated in 2034. The Le Meur law continues to tighten short-term rental regulation. FNAIM notes that rent-control zones now cover 48% of the private rental stock, and argues that a supply shortage cannot be solved by capping prices.
Mortgage Market and Interest Rates
The ECB Has Started Raising Rates, and French Mortgages Are Following
This is where the sharpest reversal has occurred, and it is the mechanism driving most of what is happening elsewhere in the market.
France's mortgage loan interest rates:
Our February 2026 edition reported ECB key rates on hold since June 2025, no move at the February 2026 meeting, and a broad consensus that "dramatic mortgage rate swings are unlikely in 2026." That assessment has been overtaken. On 11 June 2026, the Governing Council raised all three key rates by 25 basis points, the first increase in three years, taking the deposit facility rate to 2.25% with effect from 17 June. It held in July, then raised again on 10 September 2026, lifting the deposit facility to 2.50%, the main refinancing rate to 2.65% and the marginal lending facility to 2.90%, all effective from 16 September.
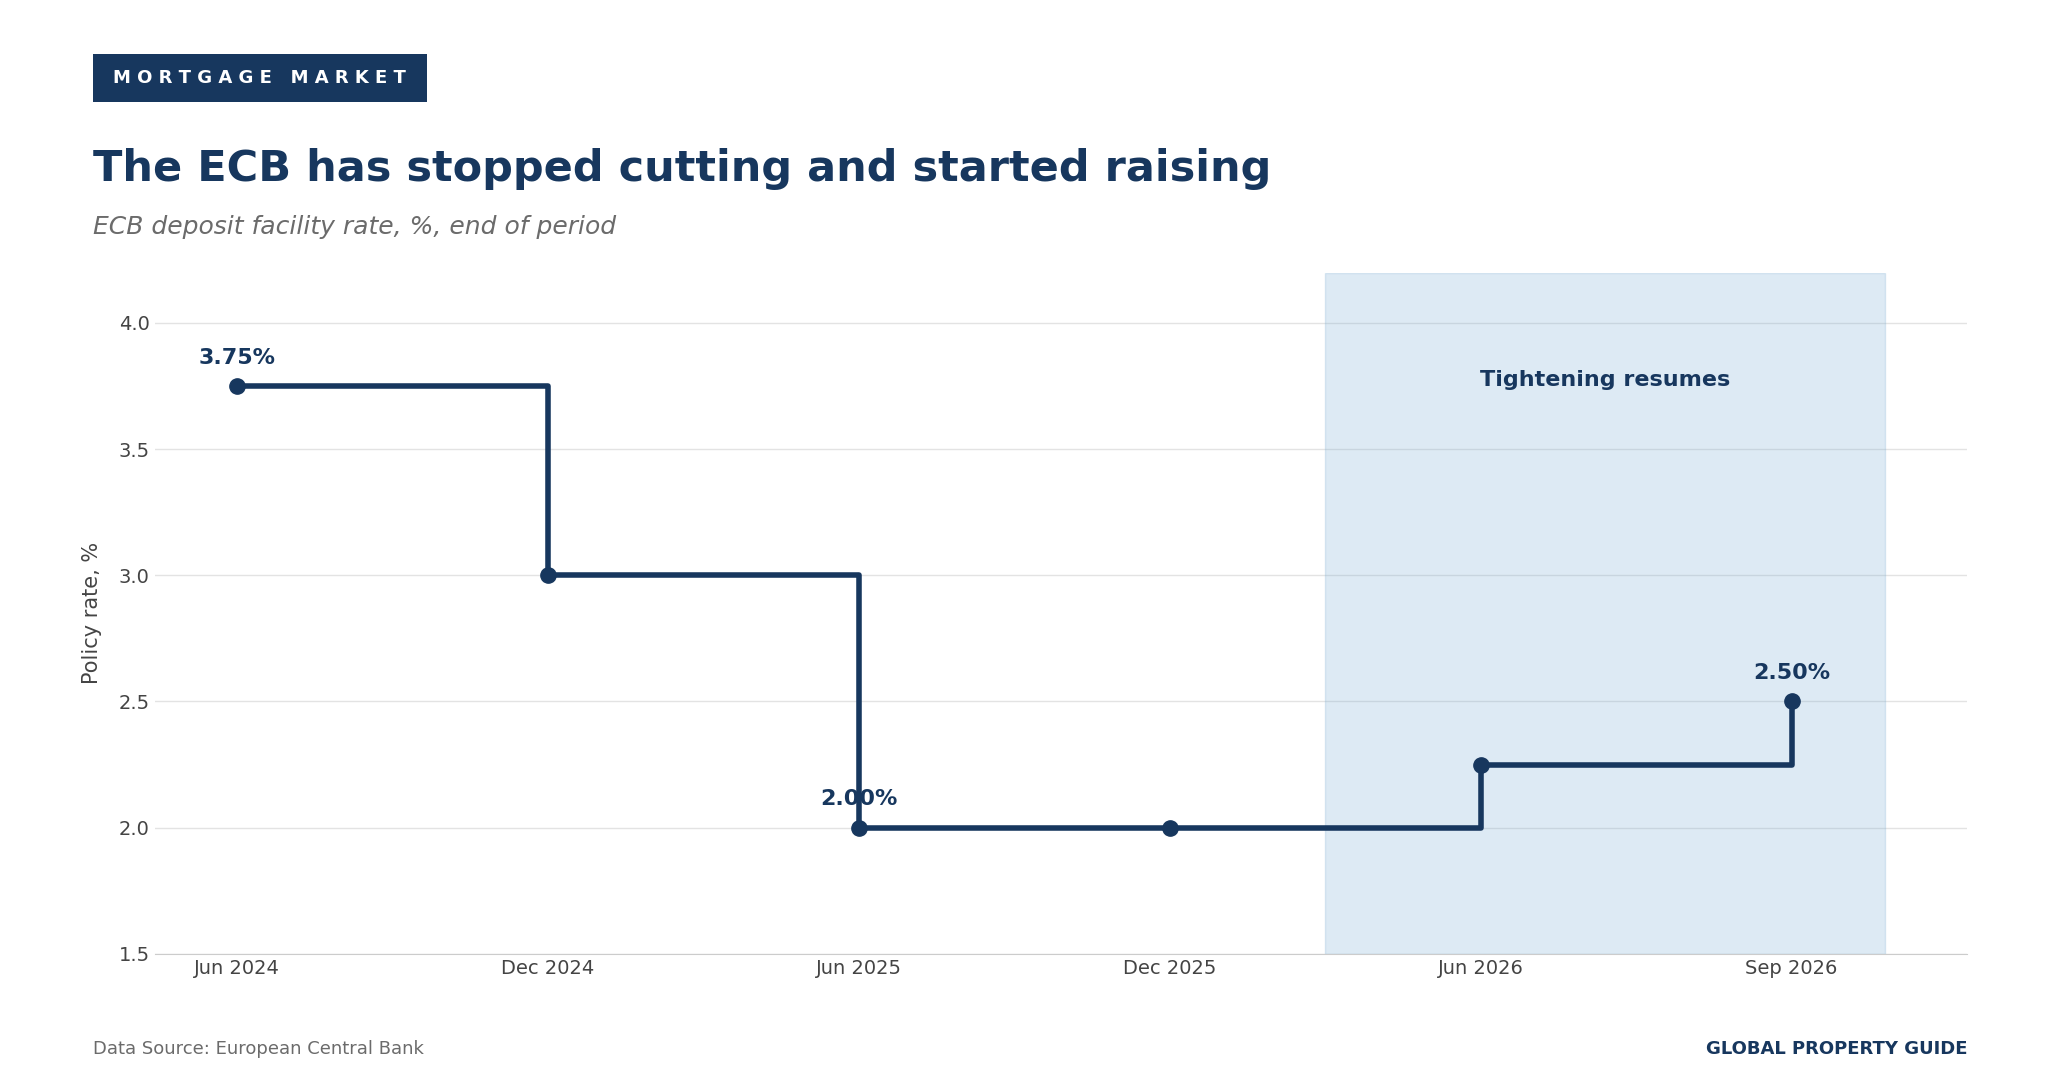
The ECB attributes both moves to the conflict in the Middle East, which it says "continues to generate inflation pressures," with inflation set to remain well above target for an extended period. Its September staff projections put euro area headline inflation at 3.0% in 2026, 2.5% in 2027 and 2.1% in 2028, with a peak of 3.6% expected in the fourth quarter of this year. Growth projections were revised up to 0.9% for 2026 and 1.4% for 2027, on what the Governing Council called greater-than-expected resilience.
Pass-Through to Borrowers Has Been Partial So Far
French mortgage rates bottomed in December 2025 and have risen every month since, but by considerably less than the policy rate.
The Banque de France reports the average rate on new housing loans excluding renegotiations at 3.30% in July 2026, up from 3.27% in June and 3.21% in May. That is 22 basis points above the December 2025 trough of 3.08% and 21 basis points above the 3.09% recorded in July 2025. Against 50 basis points of ECB tightening, roughly 44% has reached new borrowers so far.
| Average interest rates on new housing loans in France | ||||
| Jul 2026 | Jun 2026 | May 2026 | Jul 2025 | |
| Housing loans, all | 3.19% | 3.17% | 3.11% | 3.01% |
| Excluding renegotiations | 3.30% | 3.27% | 3.21% | 3.09% |
| Fixed-rate housing loans | 3.15% | 3.13% | 3.08% | 2.97% |
| Bridge loans | 3.75% | 3.70% | 3.64% | 3.56% |
| Data source: Banque de France. | ||||
Bridge loans deserve separate attention. At 3.75%, they have risen 19 basis points over the year and now sit 45 basis points above the all-loans rate, a spread that falls directly on the second-time buyers the notaries identify as the most constrained group in the market.
The French market remains overwhelmingly fixed-rate, with 99.4% of new housing loans written on fixed terms in July 2026. That structure protects existing borrowers entirely from the ECB's moves and concentrates the whole adjustment on new lending, which is precisely why transaction volumes rather than household balance sheets are absorbing the shock.
Lending Volumes Are Stuck at the Bottom of Their Range
New housing lending excluding renegotiations fell to EUR 11.0 billion (USD 12.8 billion) in July 2026, from EUR 13.2 billion in June and EUR 12.5 billion in July 2025. The Banque de France describes production as remaining "at the lower end of its fluctuation range since the fourth quarter of 2024."
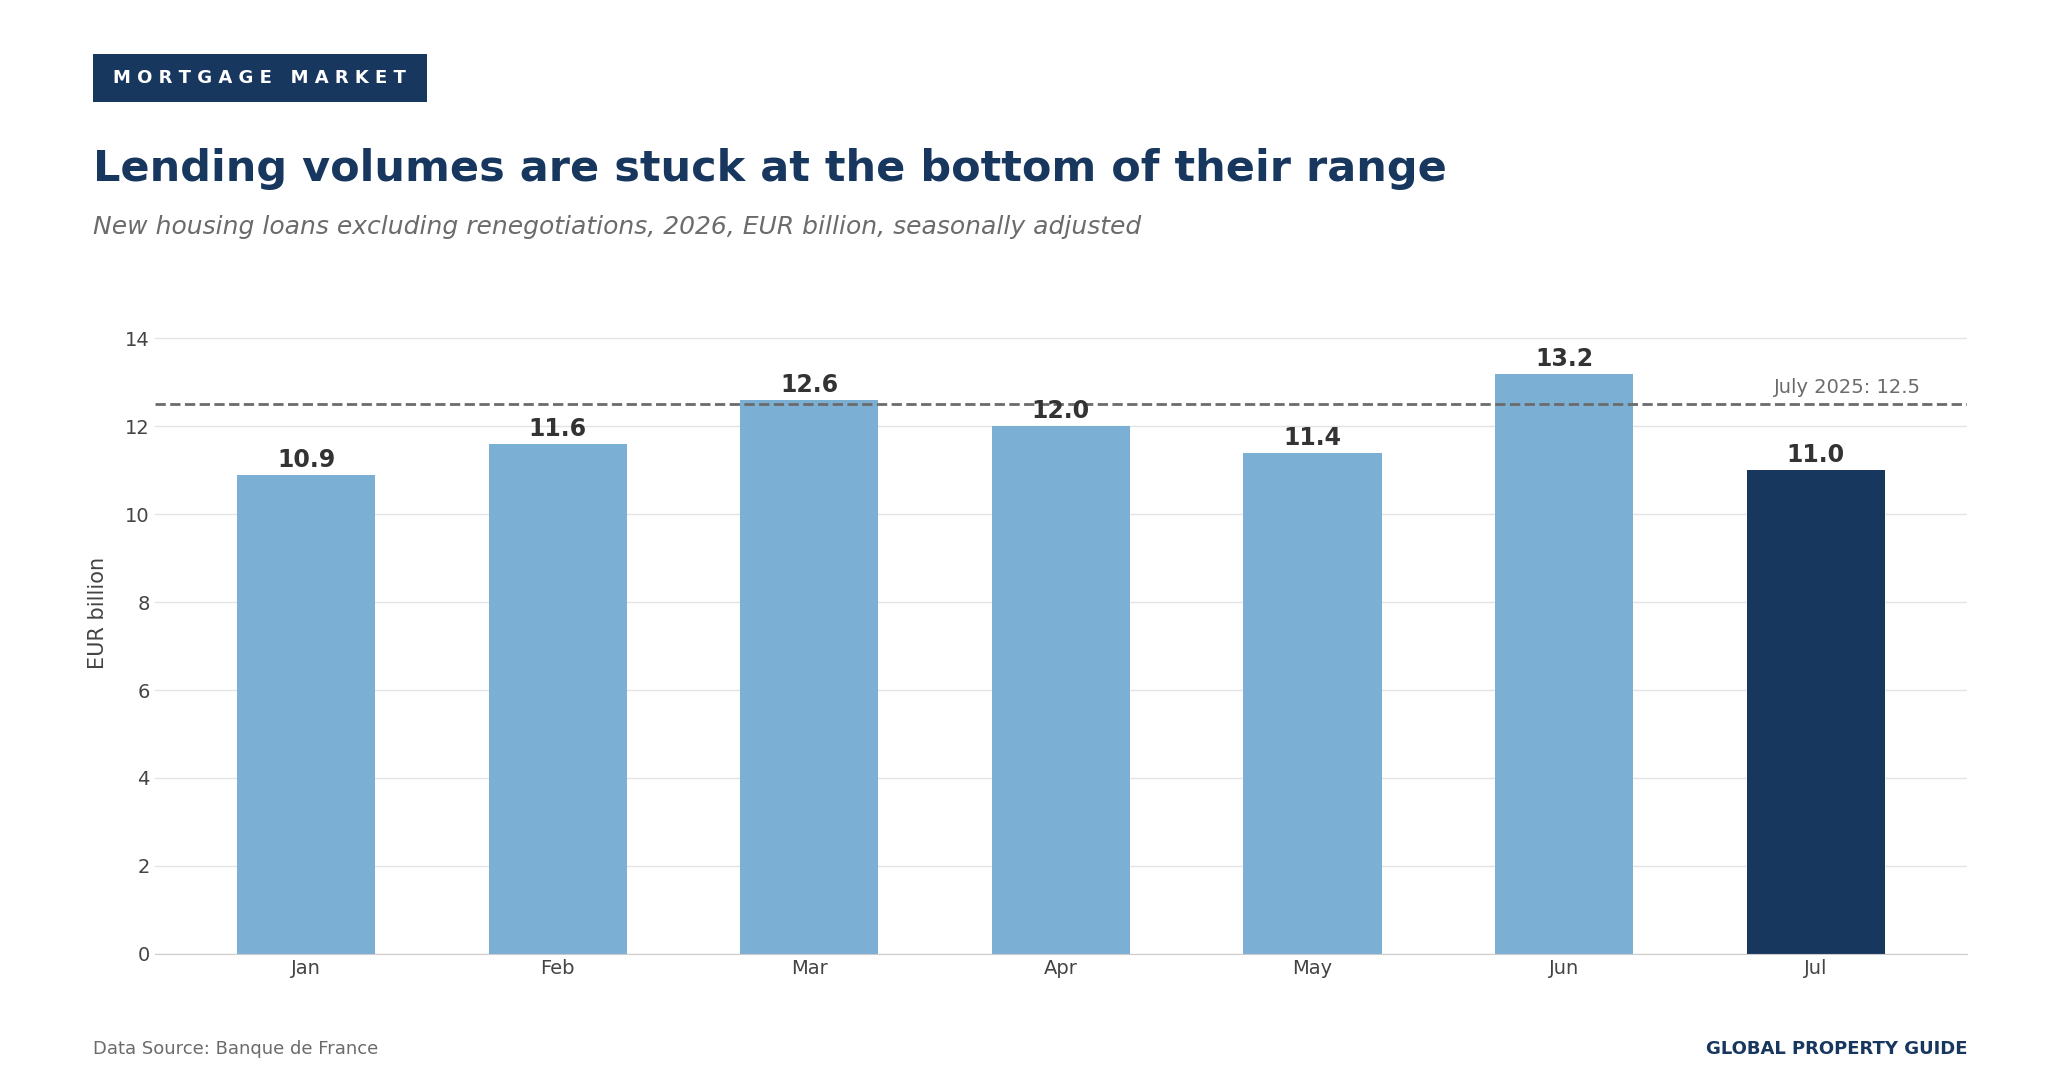
Across the first seven months of 2026, monthly production has oscillated between EUR 10.9 billion and EUR 13.2 billion without establishing a trend. Outstanding housing loans to individuals reached EUR 1,289 billion (USD 1.50 trillion) at the end of July, growing just 0.2% year-on-year, against 0.8% for households on the broader definition.
One borrower group is moving against the tide. The Banque de France notes that since early 2025, the number of loans granted to first-time buyers has grown faster than both home sales and lending to all borrowers, which corroborates what the notaries report from the transaction side. The average initial term for a principal residence stands at 23 years and 5 months for all borrowers and 23 years and 11 months for first-time buyers.
Sovereign borrowing costs are the channel to watch from here. The ten-year French government reference rate stood at 4.09% on 28 August 2026, against roughly 3.3% in October 2025. The sovereign ten-year now yields more than the average new mortgage, a configuration that leaves little room for lenders to absorb further increases in funding costs, and it is the mechanism the notaries have in mind when they warn that a rise in home loan rates could stall the recovery.
Economic and Social Factors
An Energy Shock, a Stalling Economy and an Unresolved Budget
The macroeconomic backdrop has deteriorated on every dimension covered in our previous edition.
Inflation has returned. Consumer prices rose 2.4% year-on-year in August 2026 according to INSEE's provisional estimate, after 2.1% in July, with the harmonized index at 2.7%. Our February 2026 edition reported inflation at 0.3% in January, and the European Commission expects 1.3% for the year.
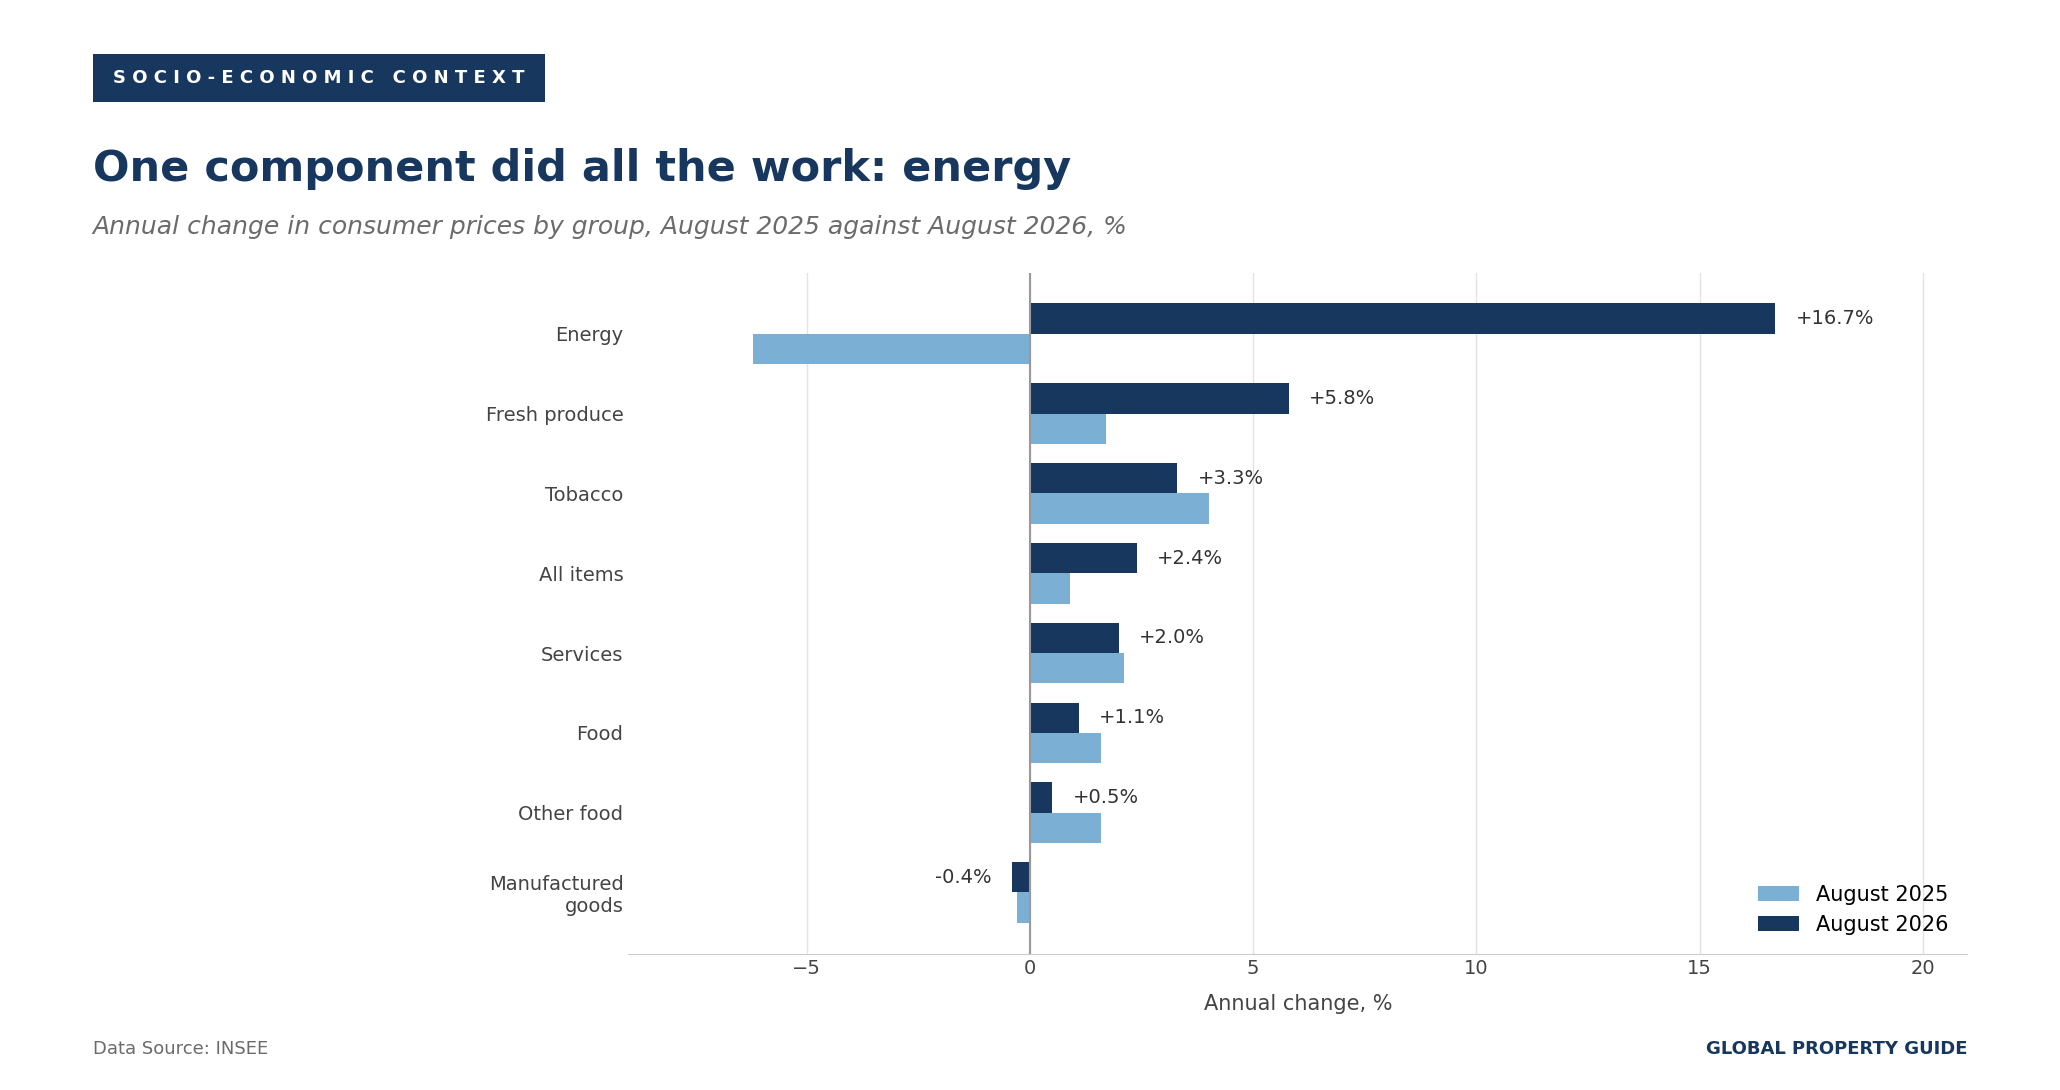
The composition is unusually concentrated. Energy prices rose 16.7% year-on-year in August, against a 6.2% decline in August 2025, a swing of nearly 23 percentage points driven mainly by petroleum products. Services inflation is unchanged at 2.0%, manufactured goods are still falling at 0.4%, and food is up just 1.1%. Almost the entire acceleration is in one component.
Growth has stalled. GDP was flat quarter-on-quarter in Q2 2026. In its September conjuncture note, INSEE cut its 2026 growth forecast to 0.4% from the 0.7% expected in June, projected inflation reaching 2.9% by December, and forecast the loss of 52,000 salaried jobs across the year after 48,000 lost in 2025.
Unemployment Is Rising, and France Is Alone in That
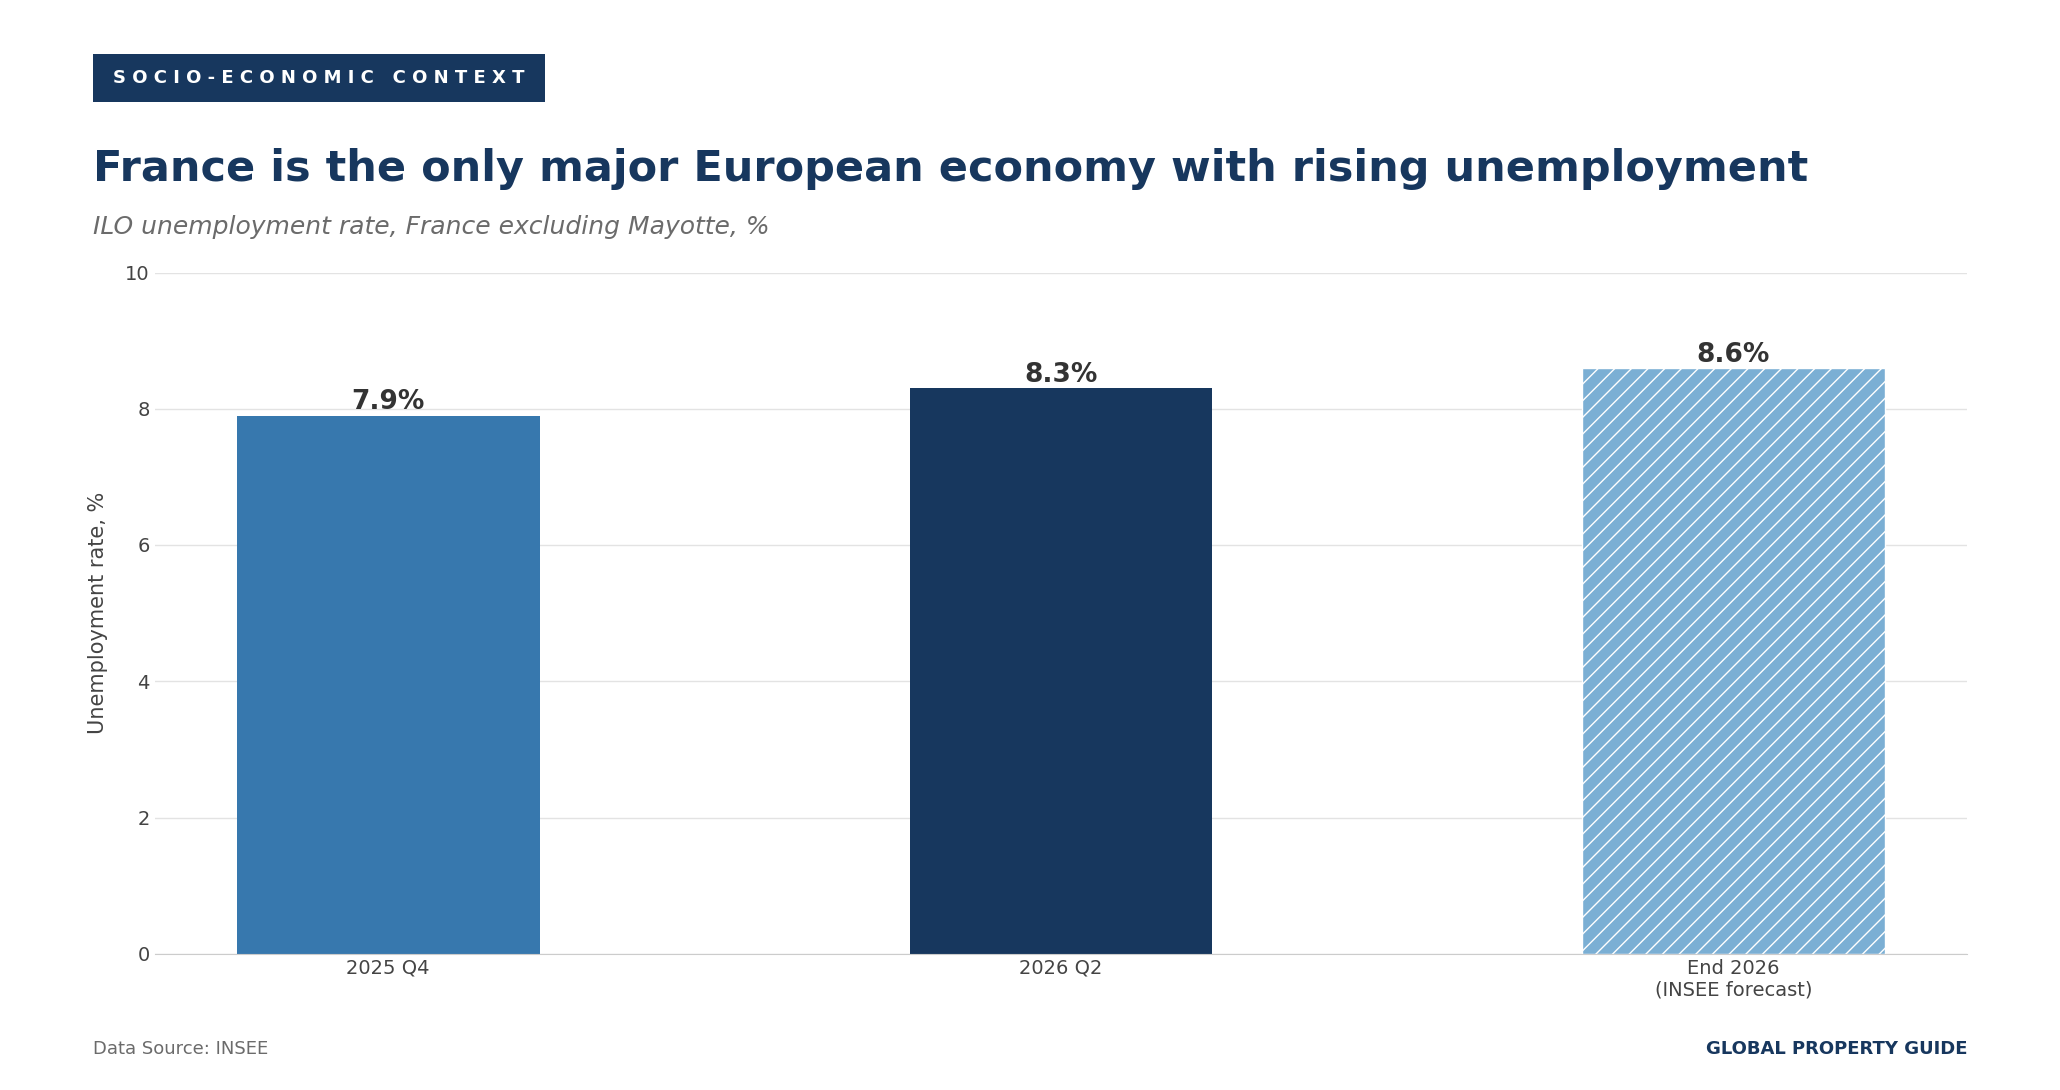
The ILO unemployment rate reached 8.3% in Q2 2026, up 0.2 points on the quarter and 0.4 points above the 7.9% recorded in Q4 2025. INSEE expects 8.6% by the end of the year and notes that France would then be the only major European economy with rising unemployment.
Household confidence stood at 86 in August and the business climate in construction at 96, both below their long-run norms.
Public Finances Remain the Central Political Risk
Fitch Ratings affirmed France at A+ with a stable outlook on 28 August 2026, avoiding a further downgrade, but revised its fiscal projections materially. The agency now expects a general government deficit of 5.2% of GDP in 2026, up from the 4.9% it forecast in March, followed by 5.5% in 2027 and 5.2% in 2028. It projects public debt reaching 122.7% of GDP by 2028, from 115.7% in 2025, more than double the median for similarly rated sovereigns. Fitch cited the resilience of a large, prosperous economy with a solid banking sector, while noting that short-term growth will remain modest and that political fragmentation continues to limit the capacity for fiscal adjustment.
France's other ratings stand at Aa3 with a negative outlook from Moody's, A+ stable from Standard and Poor's, AA stable from DBRS, and AA- negative from Scope.
The political context has not eased. Sebastien Lecornu remains prime minister, the fifth in under two years. The 2026 budget became law in January only through article 49.3, without a parliamentary vote, after the National Assembly deadlocked through the whole of 2025. Pension reform has been suspended until after the 2027 presidential election. The 2027 finance bill now goes to parliament less than six months before that election, which is the single largest source of uncertainty facing both the housing market and the sovereign.
The notaries capture the practical consequence for housing as well as for anyone, a slow recovery remains the central scenario, but only if financing conditions hold steady, and beyond that, "la visibilite demeure faible."
Sources:
- National Institute of Statistics and Economic Studies (INSEE)
- In Q2 2026, Prices of Existing Dwellings Fell by 1.0% (FR): www.insee.fr
- In Q2 2026, the Rent Reference Index Increased by 1.15% Over a Year (FR): www.insee.fr
- Between January and April 2026, Rents Increased by 0.2% (FR): www.insee.fr
- In August 2026, Consumer Prices Would Rise by 2.4% Year on Year (FR): www.insee.fr
- Conjuncture Dashboard (FR): www.insee.fr
- European Central Bank (ECB)
- Monetary Policy Decisions, 10 September 2026: www.ecb.europa.eu
- Monetary Policy Decisions, 11 June 2026: www.ecb.europa.eu
- ECB Staff Macroeconomic Projections, September 2026: www.ecb.europa.eu
- Euro Foreign Exchange Reference Rates: www.ecb.europa.eu
- Key ECB Interest Rates: www.ecb.europa.eu
- Bank of France
- Loans to Individuals, France 2026-07: www.banque-france.fr
- Statistical Data and Studies Department (SDES)
- Housing Construction: Results at the End of July 2026 (FR): www.statistiques.developpement-durable.gouv.fr
- Marketing of New Housing, Sales to Individuals in the 2nd Quarter of 2026 (FR): www.statistiques.developpement-durable.gouv.fr
- Marketing of New Housing, Sales to Institutional Buyers in the 2nd Quarter of 2026 (FR): www.statistiques.developpement-durable.gouv.fr
- New Construction (FR): www.statistiques.developpement-durable.gouv.fr
- Notaries of Greater Paris
- Real Estate Conditions in Ile-de-France in Q2 2026 (FR): paris.notaires.fr
- Press Dossier, Q2 2026 (FR): paris.notaires.fr
- National Real Estate Federation of France (FNAIM)
- Fragile Market Recovery, Political Inertia and a Supply Crisis (FR): www.fnaim.fr
- Agence France Trésor
- France's Credit Ratings: www.aft.gouv.fr
- Fitch Ratings
- France Sovereign Rating Actions: www.fitchratings.com
- Legifrance
- Law no. 2026-103 of 19 February 2026, Finance Law for 2026 (FR): www.legifrance.gouv.fr
- Legal and Administrative Information Department
- Rent Reference Index (IRL) (FR): www.service-public.fr
- Rental Investment Schemes (FR): www.service-public.fr
- Real Estate Diagnostics: Energy Performance Diagnostics (FR): www.service-public.fr
- Global Property Guide
- Gross Rental Yields in France: Paris and 7 Other Cities: www.globalpropertyguide.com
- France Residential Property Market Analysis: www.globalpropertyguide.com
- European Commission
- Economic Forecast for France: economy-finance.ec.europa.eu
- Distribution of Population by Tenure Status: ec.europa.eu