India's stunning house price boom continues!
India’s housing markets surged in Q2 2011. There were amazingly strong house price increases, despite an economic slowdown which saw gross domestic product grow by ‘only’ 7.7% during the year to Q2 2011, the weakest growth for six quarters, due to high interest rates and the poor performance of mining and quarrying (1.8% annual growth), construction (1.2%) and the manufacturing sectors (7.2%).
India ranked second out of 50 countries for annual growth of residential prices, in Knight Frank’s latest global housing price index. During year to Q1 2011, house prices rose 21.3%.

According to India’s National Housing Bank (NHB), house prices in New Delhi rose by 33.64% during the year to Q2 2011 (22.7% in real terms) and by 16.67% from the previous quarter (15.84% in real terms).
House prices also soared in other cities, especially in cities with strong offshoring and business process outsourcing. Yet even cities that rely on manufacturing and electronics, which suffered during the financial crisis in 2009 (e.g. Hyderabad, Kochi, Bengaluru), are now showing signs of recovery.
House prices rose in almost all major cities in India from Q1 to Q2 2011. There were astonishing price hikes in Bhopal (34.13% on a quarter-on-quarter basis), Faridabad (33.33%) and Kochi (24.42%), according to NHB figures – so strong are the rises, that one wonders whether these NHB figures can be relied on (we would be interested in readers’ views!).
Chennai also had decent average price rises of 13.76% q-o-q to Q2 2011. House prices in Bengaluru and Mumbai rose by 4.55% and 3.42% respectively.
Two out of the 15 major cities covered by the NHB Residex had quarterly house price drops: Jaipur (-4.48%) and Kolkata (-8.06%). Patna’s house price index remained unchanged from Q1 to Q2 2011. The Residex only started publishing quarterly figures in 2010; from 2008 to 2009, the Residex was updated semi-annually.
Compared to last year:
- Property prices rose in all major cities covered by the NHB. The top five were Bhopal (46.41%), Faridabad (44.74%), Chennai (35.52%), Bengaluru (35.29%), and New Delhi (33.64%).
- The cities with the lowest price increases were Kolkata (10.23%), Surat (9.56%) and Jaipur (4.92%).
Residential property demand is expected to remain strong in India throughout 2011, due to the strong business climate. Yet higher rates could pose a threat. The Reserve Bank of India again raised its repo rate by 25 basis points to 8.25% in September 2011, the 12th time that the central bank has increased the interest rate since March 2010.
Inflation reached a 13-month high of 9.87% in September 2011, double the RBI’s target of 4% to 4.5%. The economy is expected to slow to 8% GDP growth this year, down from 10% in 2010.
House prices roaring ahead
Indian house prices rose rapidly from 2002 to 2007. Strong economic growth and urbanization supported house prices, while in city centres a housing bubble was encouraged by inadequate infrastructure, lack of planning and antiquated land use laws.
The price increases were accompanied by low interest rates. Home loan rates fell to a historically low rate of 7.5% in early 2004 until 2005.
From 2005 to 2007, the economy grew at 8.9% per annum, making it one of the world’s fastest growing, after 7.6% per annum growth from 2003 to 2004.
The liberalization of major sectors of the Indian economy during the early 1990s brought a rapid influx of foreign direct investment into the country. A boom in the ICT and BPO industry generated rapid employment growth, increasing the demand for housing and causing a ripple effect in the construction and telecommunications sectors.
Yet though house price increases were supported by these strong fundamentals, speculation also played a role. From 2000 to 2006, residential property became significantly less affordable. By 2002, a dwelling in Mumbai cost around 85 times the average annual average income. By 2006, residential properties in Mumbai cost 100 times the average annual income.
Developers’ capital rapidly grew as their stock prices increased, and they used it to bid high prices for huge plots of land, making it relatively easy to sell properties at very high prices.
Flashback to the global crisis
If there is a slowdown, it won’t be the first. During the world economic downturn in 2008, India’s developers cut prices and introduced lucrative deals such as subsidized furniture and internet connections.
Demand for luxury housing fell 50%, while affordable housing demand fell 10%, according to a May 2009 survey by the Associated Chambers of Commerce and Industry of India (Assocham). House prices in Delhi fell by as much as 13.08% during the year to H2 2009. Developers refocused on building low-income homes.
But India’s economy quickly rebounded, and house prices soon started rising again.
Interest rate hikes may continue

In September 2011, the RBI raised its policy lending rate by 25 basis points to 8.25%, the 12th interest rate hike since March 2010, when the RBI moved rates up from 4.75% to 5% to contain inflation.
The RBI’s prime lending rates are also heading up, having been dropped to 7.50% (low) and 8% (high) in July 2010, from 11% and 12% respectively. As of March 2011, prime lending rates are 8.25% (low) and 9.50% (high).
According to Finance Secretary RS Gujral, the government is now concentrating on fighting inflation and slowing growth. The RBI may hike rate again, as inflation remains high at 9.87%.
The increase in interest rates is already being felt in the construction sector, which grew by only 1.2% in Q2 2011, an 8.2% drop from the previous quarter. More construction gloom is expected to follow.
India’s small mortgage market
Despite reforms since 1991, India’s mortgage market is held back by problems:
- Banks prefer to lend to middle and high-income sectors, leaving limited financing options for low-income individuals.
- The government has a huge influence on major domestic banks, discouraging initiative.
- There’s no proper legal framework for foreclosures
- Titling problems are rampant.

As a result, the ratio of housing loans to GDP is very low; in 2010, housing loans were only 4.04% of India’s GDP. The leading mortgage lender is the Housing Development Finance Corporation (HDFC) followed by the State Bank of India (SBI).
In 2010, total housing loans rose by 8.66% to INR 3009.29 billion (US$ 61.21 billion) from INR 2769.57 billion (US$ 56.33 billion) a year earlier. Interest rates at major banks and financial institutions range from 10.75% to 12% for floating rate mortgages, and 13% to 14% for fixed-rate mortgages. The loan to value (LTV) of most Indian home loans is 85%.
Relatively low yields
Rental yields remain low in India, according to Global Property Guide research. Smaller apartments have higher yields.
- Prices of smaller Mumbai apartments are around US$11,600 to US$14,000 per sq. m.; yields are poor, at 2.52% to 2.76%.
- Delhi prices are cheaper at US$4,000 per sq. m., but yields are also low, at 1.71% to 2%.
- Annual yields in Bangalore are relatively higher than in Delhi and Mumbai, ranging from 3.48% to 4.19%.
Residential rents from Q1 to Q2 2011, according to Colliers:
- In selected Mumbai areas, rents rose 2% to 5%.
- Bengaluru prime residential property rents increased by 3% to 7%.
- Delhi prime residential property rents rose by 2% - 4%
- Rents in Chennai rose by 2% to 5%, due to increasing demand and shortage of residential properties,
India’s rental market is hindered by problematic socialist laws protecting tenants. The laws are generally poorly conceived and ineffective, making implementation difficult. Although these are gradually being replaced by more market-oriented laws, the rental market’s full potential is yet to be realized.
Cities with rent controls generate lower yields. Mumbai rents in houses with sitting tenants are frozen at their 1947 levels, due to the Maharashtra Rent Act of 1999, an extension of the Bombay Rent Control Act of 1947. Delhi also has rent controls.
High inflation will slow growth
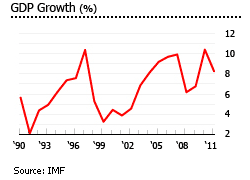 According to the IMF, economic growth is likely to slow down to around 8% for the full year 2011, down from 10% the previous year.
Investment growth slowed to 0.37% in Q1 2011 from 7.8% the previous quarter, due to rising interest rates. Consumer spending growth was 8%, down from 8.6% in the previous quarter.
The tempering of growth is also due to the reduction in the fiscal deficit. From a deficit of 5.1% of GDP at the end of March 2011, the government is targeting a deficit of 4.6% of GDP by the end of the current fiscal year in March 2012.