South Africa’s house price boom grinds to a halt
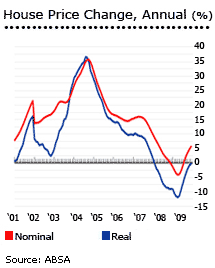
After remarkable price increases between 2000 and 2007, South Africa’s house price boom ground to a halt in Q1 2008.
Although the house price index rose 6.8% to end-April 2008 from a year earlier, it actually fell 3.84% when adjusted for inflation, according to figures from ABSA, South Africa’s leading mortgage provider.
Riding on the back of an empowered middle class, annual house price increases peaked in Oct 2004 with a remarkable 35.7% y-o-y growth (32.5% in real terms). Since then, house price gains have slowed, due to rising inflation and interest rates, and the implementation of National Credit Act in mid-2007.
House prices rose by an average of 20% annually from 2000 to 2006. But in 2007, house prices rose by a mere 11.2% (2% in real terms).
House price movement
House price growth fell in the first quarter of 2008 for all segments, but the affordable housing category had the highest house price growth drop, plummeting from 72% price rises y-o-y to end-Q1 2007, to 13.8% price rises in y-o-y to end-Q1 2008. Nevertheless, the affordable category remains the most buoyant, reflecting the broadening-out of the wealth in the new South Africa.
AVERAGE HOUSE PRICES BY SEGMENT |
|||||
(%, END OF PERIOD) |
|||||
| 2006 | 2007 | Q1 2008 | |||
Affordable (40m2-79m2, | 60.82 |
18.8 |
276,852 |
| ||
| Middle segment (80m2 - 400m2) | 16.79 | 14.5 | 975,517 | ||
| Small (80m2-140m2) | 17.21 | 11.5 | 692,679 | ||
| Medium (141m2-220m2) | 16.84 | 17.5 | 954,991 | ||
| Large (221 m2-400m2,) | 17.26 | 17.6 | 1,400,587 | ||
| New (80m2-400m2) | 14.23 | 13.6 | 1,054,684 | ||
| Existing (80m2-400m2) | 17.38 | 14.9 | 959,825 | ||
| Luxury (>R2.2m-R9.9m) | 18.50 | 8.0 | 4,239,629 | ||
| Source: ABSA | |||||
The annual average price growth of middle-segment houses (80-400 sq. m.) in Q1 2008 fell to 9.5% from 17.2% in Q1 2007. This was the first time since 2001 that the middle segment experienced single-digit price growth.
Luxury housing registered the lowest house price growth rate. The average price for luxury houses rose 6.7% to ZAR 4,239,629 (US$538,982) in Q1 2008 from a year earlier.
Metropolitan Regions
All metropolitan areas registered lower house price growth in the year to the end of the first quarter of 2008, relative to the equivalent previous year. Five out of ten metropolitan regions exhibited single digit house price growth - Pretoria, Cape Town, Central and South Johannesburg, Bloemfontein, East London, and Durban. Bloemfontein had the lowest growth with an 0.9% annual price rise.
AVERAGE HOUSE PRICES BY METROPOLITAN AREA |
|||||
(%, END OF PERIOD) |
|||||
| 2006 | 2007 | Q1 2007 | Q1 2008 | Q1 2008 | |
| South Africa | 15.3 | 14.5 | 1,431,118 | ||
| Pretoria | 13.6 | 15.9 | 1,100,743 | ||
| Cape Town | 14.6 | 10.3 | 1,110,356 | ||
| Greater Johannesburg | 18.1 | 14.8 | 1,078,773 | ||
| Central & South | 23.0 | 12.4 | 879,460 | ||
| North & West | 16.7 | 14.9 | 1,322,279 | ||
| East Rand | 18.1 | 14.7 | 945,771 | ||
| Durban/Pinetown | 18.2 | 15.3 | 992,884 | ||
| East London | 12.4 | 12.3 | 949,406 | ||
| Bloemfontein | 18.7 | 22.4 | 1,006,158 | ||
| PE/Uitenhage | 14.8 | 12.4 | 920,072 | ||
| Source: ABSA | |||||
Average house prices are highest in North and West Johannesburg at ZAR 1,322,279 (US$168,101) in Q1 2008, up 11.5% from a year earlier. Johannesburg is South Africa’s largest city and the centre of manufacturing, financial and economic activities, and home to Africa’s largest stock exchange.

Often mistakenly thought of as the country’s capital, Johannesburg is actually not even one of its three capitals. Pretoria which is quite near Johannesburg is the national and executive capital, Cape Town is the legislative capital, and Bloemfontein is the judicial capital.
Fundamentals at work
Four main forces drove South African house prices up. The first was emergence of a financially stable black middle class. Since the end of Apartheid, blacks have found new opportunities and new financial strength. This development has had a tremendous impact on housing demand and the economy.
The strong growth of households’ real disposable income was somewhat encouraged by tax reliefs for individuals, in the context of a strongly growing economy. Average real GDP growth was 4% from 2000 to 2006, with real disposable income rising by an average of 4.7% over the same period.
In 2006, the CGT exemption on a primary residence was raised from ZAR1 million (US$127,129) to ZAR1.5million (US$190,694). Transfer duties on properties have been lowered too. For example, no transfer duty is payable on properties valued at ZAR500, 000 (US$63,565) or less.
The second factor was that South Africans who had parked money offshore during the Apartheid era were allowed (and required) to bring it back by September 2004. Much of this money has gone into property.
Better stability and security have helped. During Apartheid and its sequel, property prices badly lagged the economy, as the security situation went from bad to worse. Now the country seems back on track. This feeling was reflected in rising business confidence indicators, and in the significant strengthening of the South African rand.
Lastly, the Financial Sector Charter in 2003 boosted mortgage loan growth. Financial institutions committed to provide ZAR 42 billion (US$ 5.45 million) of housing finance to the low income market.
From ZAR 332 billion (US$ 43.1 million) in 2003, the value of total mortgage extended to the domestic private sector has grown to ZAR 853 billion (US$ 110.8 million) in 2007.
Housing market slowdown
The recent slowdown of house price growth can be attributed to two factors - namely, the full implementation of the National Credit Act, and interest rate hikes.
The National Credit Act aims to protect borrowers from over-indebtedness. It requires lenders to disclose every term in the contract. It also limits the amount of funds that can be borrowed. Furthermore, the Act gives the borrowers the right to request their credit report, and to challenge the report if there are inaccuracies. Lastly, the law requires every lender to assess borrowers’ credit-worthiness. The act has tended to reduce the supply of mortgage loans.
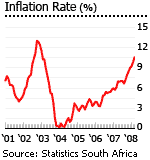
In line with global trends, surging oil and food prices have led to increased inflationary pressures since 2006, with inflation reaching 11.1% in April 2008. This is higher than the inflation rate in previous years - 7.1% in 2007 and 4.7% in 2006.
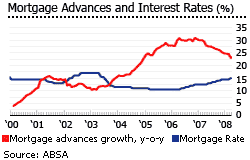
Interest rate hikes were implemented to quell inflationary pressure. Mortgage rates on new loans have risen to 15% in May 2008 from its historical low of 10.5%, in effect from May 2005 to May 2006. Concurrently, the growth of mortgage advances has slowed. From an annual average growth of 30% in April of 2006, annual mortgage loan growth has fallen to 22% in April 2008.